海洋在碳循环和全球气候变化具有十分重要的作用,而在大气和深海之间物质转移的调节过程中,上层海洋生态系统作用最为显著[1-3]。西太平洋作为全球热带风暴、台风形成最多的地区,是印度洋-太平洋暖池的重要组成部分;这个区域的海洋变化不仅能够影响局地及边缘海的气候和生态环境条件,对整个热带太平洋乃至全球气候的变化都能产生重要深远的影响[4]。此外,赤道西太平洋上层水的流系甚为复杂, 研究这一海域上层水中化学组分的变化特征对了解整个大洋中的物质循环有重要的作用[5]。
海水营养盐作为海洋生物赖以生存的物质基础之一,在光合作用过程中,浮游植物摄取营养元素作为其组成部分,并成为其物质和能量代谢的来源,它的含量影响海洋生物生产力与生态系统的结构特别是浮游植物的群落结构。因此,营养盐的分布和循环机制对了解海洋生态系统初级生产过程至关重要的。过去几十年中, 在热带海洋与全球大气(TOGA)和世界海洋环流实验(WOCE)计划框架下, 先后有多项观测调查项目在热带西太平洋实施[6]。但是,对热带西太平洋生源要素生物地球化学过程的研究较为缺乏。本文利用2017年秋季赤道西太平洋的调查数据,对其上层水体中营养盐的垂直分布进行了分析,以期深入认识赤道西太平洋上层水体营养盐的含量、分布特征及其影响机制,为全球变化影响下赤道西太平洋生源要素生物地球化学循环机制研究提供基础资料。
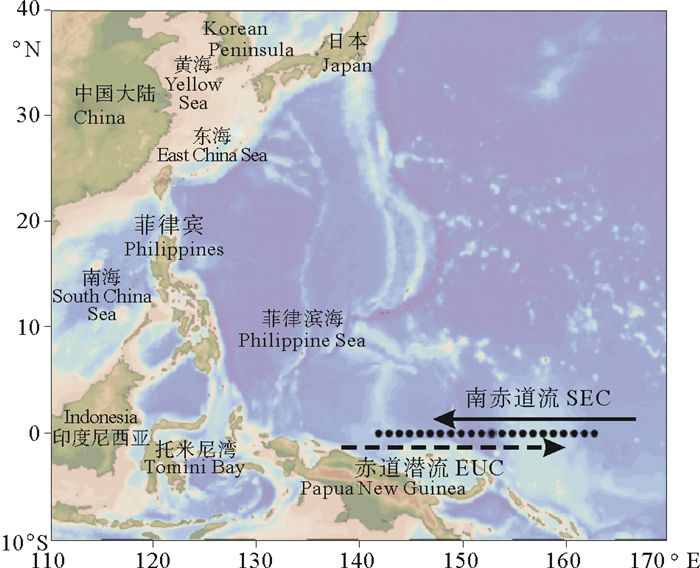
1 材料与方法 1.1 调查海域2017年秋季(10—11月)搭乘“东方红2”船在西太平洋进行综合调查,该航次在赤道西太平洋赤道海域布设了22个站位(142°E~163°E),站位布设如图 1所示,每个站位均采集6层(表层、30、75、100、150和300 m)。

|
图 1 赤道西太平洋采样站位示意图 Fig. 1 Sampling stations in the equatorial Western Pacific Ocean |
该调查海域主要涉及流系有南赤道流(SEC)、赤道潜流(EUC)。南赤道流为横跨赤道两侧的西向海流,由东南信风引起的,其北界通常可越过赤道抵达2°N~3°N附近[7]。该海流自东太平洋流入,水团核心分布于表层到100 m左右,由浅而深自东向西伸展,具有高温、高盐的水系特征[8-10]。在南赤道流以下,为准永久的东纬向压力梯度所引起的东向赤道潜流[11],它起源于巴布新几内亚北部,大约135°E处[12-13],存在100~300 m左右深度[14]。其流轴是以赤道为中心, 最大范围可扩展到南北纬2°之间, 最小范围在南北纬1°左右[15-16]。在东流过程中,其流轴不断上翘,深度自西至东是由深变浅, 由赤道西太平洋的100~200 m至赤道东太平洋的50~100 m,且沿赤道南、北有一个纬距的摆动幅度[7, 15]。它是整个太平洋环流系统中的一条定常流,具有高温、高盐和髙溶解氧的特征[17-19]。
1.2 样品采集和分析方法海水温度和盐度由CTD现场测定,溶解氧(DO)采用碘量法现场测定。所采集的海水样品经0.45 μm醋酸纤维膜(经1‰的盐酸浸泡24 h后用Mili-Q水冲洗至中性)过滤。取部分滤液现场测定溶解态无机氮(DIN)和无机磷(DIP)[20]。其中NH4-N用次溴酸钠氧化法测定,NO3-N为Cd-Cu还原法,NO2-N为α-萘乙二胺分光光度法,PO4-P为磷钼蓝法,SiO3-Si为硅钼蓝法;另一部分滤液直接装于聚乙烯瓶(预先于HCl溶液中浸泡24 h,后用蒸馏水及Milli-Q水洗至中性),-20 ℃条件下冷冻保存,回岸上实验室分析溶解总氮(TDN)和溶解总磷(TDP)。TDN和TDP的测定采用碱性过硫酸钾氧化法[21]进行,溶解有机氮(DON)和溶解有机磷(DOP)则根据TDN、DIN和TDP、DIP的差值计算得出:DON=TDN-DIN;DOP=TDP-DIP。
2 结果与讨论 2.1 温度、盐度的分布特征从图 2中可以看出,随深度的增加,温度从表层的35 ℃左右逐渐降低至300 m水层的11℃左右,150 m以深温度的垂直分层明显。在30 m处(148°E~153°E)温度相比于同层次深度较高, 可能是由赤道信风驱使的南赤道流高温水南北摆动引起的[9-10]。另外,在50~150 m深度,温度垂直分层较不明显,其中100 m处(147°E~155°E)温度相比于同层次深度较高,可能受南北纬摆动的赤道潜流高温性质水团的影响[22-23]。

|
图 2 秋季赤道西太平洋上层水体温度、盐度的垂直分布 Fig. 2 Vertical profiles of temperature and salinity in the upper water of the equatorial Western Pacific Ocean in autumn |
秋季盐度的垂直分布趋势具有一定的复杂性。在50 m以浅,断面内西侧盐度相对较低,且沿深度增加向东部扩散,可能受西太平洋暖池高温低盐水影响[24]。50~150 m以浅盐度随深度逐渐增大,150 m以深则随深度逐渐降低且垂直分层明显。150 m水层附近出现高盐度现象,其量值大约为35.3,可能是受南太平洋亚热带高盐水影响的赤道潜流引起的[16, 25]。在表层到50 m深度,断面内东侧盐度相对同层次较高,可能是在南赤道流作用下次表层高盐水涌升引起的[25]。
2.2 溶解氧的分布特征秋季赤道西太平洋表层到300 m水深区域内溶解氧的垂直分布如图 3所示。DO在表层到30 m水体中混合均匀且含量较高,主要是由于大气中的氧通过气体交换进入海洋表层和浮游植物光合作用产氧所致,而在此水深约1/3海域的表观耗氧量(AOU)出现负值说明除大气交换外存在其他的氧气来源。在30~75 m水体中,DO平均含量为6.1 mg/L,但此水深约80%的海区AOU出现正值,说明浮游植物光合作用产氧减弱,呼吸作用耗氧开始增强。在100~150 m水层中DO含量随深度逐渐降低,层化现象明显,主要是浮游植物呼吸作用增强以及有机物的氧化作用耗氧导致的结果。另外,在100 m以浅,DO断面内东侧含量相对同层次较高,可能在南赤道流作用下赤道潜流高溶解氧水团涌升引起的[22, 26]。在150 m以深水体中,DO的平均含量为4.5 mg/L,AOU随水深逐渐增大,有机物的降解和无机物的氧化作用等过程起主导作用。

|
图 3 秋季赤道西太平洋上层水体溶解氧及表观耗氧量的垂直分布 Fig. 3 Vertical profiles of DO and AOU in the upper water of the equatorial Western Pacific Ocean in autumn |
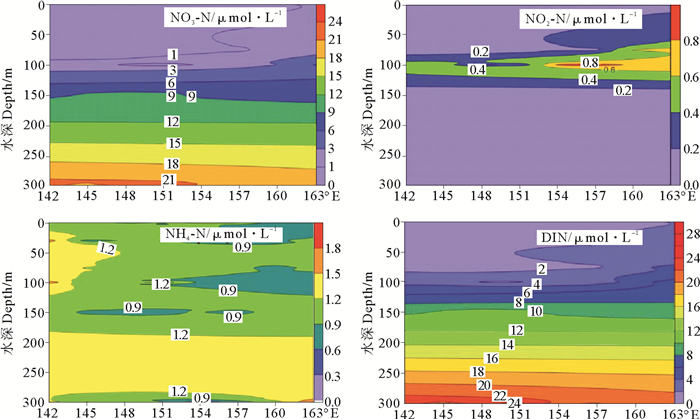
秋季西太平洋上层水体各形态氮的垂直分布如图 4所示。该调查水域秋季NO3-N、NO2-N、NH4-N和DIN的浓度变化范围分别为0.01~27.85、0.04~1.10、0.18~2.40和0.30~28.41 μmol·L-1。从表层到300 m水层,各水层NO3-N占DIN的含量均在90%以上,是DIN的主要组成部分。

|
图 4 秋季赤道西太平洋上层水体各形态氮的垂直分布 Fig. 4 Vertical profiles of various forms of nitrogen in the upper water of the equatorial Western Pacific Ocean in autumn |
NO3-N和DIN在水层的垂直分布趋势相似,都呈现出随着水深的增加其浓度逐渐增大的趋势,符合大洋营养盐的一般分布规律[27]。在100 m以浅含量极低,这是由于浮游植物生长消耗所致。在100 m以深NO3-N和DIN含量随深度逐渐升高且具有明显的垂直分层,这是因为生物新陈代谢过程的排泄物和死亡后的残体从上层水体迁出,在100 m以深的水层由于微生物的矿化作用和氧化作用,重新转化为无机氮释放至水体中。NH4-N的垂直分布规律不明显,浓度主要集中在0.8~1.2 μmol·L-1之间,调查海域东部表层和100 m处NH4-N较低。
从图 4可以看出,NO2-N在赤道西太平洋上层水的含量很低,在总无机氮中所占份额很小,该海域存在明显的次表层亚硝酸盐最大值现象。在100 m水层附近NO2-N含量相对较高,量值最大可达0.80 μmol·L-1以上。而75 m以浅和150 m以深水层NO2-N浓度较低。在100 m深度出现次表层亚硝酸盐最大值现象的成因可能是氨氧化细菌作用下的氨氧化过程将NH4-N转化成NO2-N[28]或浮游植物的排泄释放使得亚硝酸盐积聚[28-30]。
NO2-N作为NO3-N和NH4-N转化的中间体,其含量的动态变化能为海洋生物地球化学过程的研究提供重要信息。研究表明,在大洋和近海的层化区域,真光层底部亚硝酸盐含量通常达到一个极大值,而在更浅或更深的水层亚硝酸盐的浓度接近于零[31]。此现象被称为次表层亚硝酸盐最大值[32-33]。Wooster等观测到南太平洋广大海域存在明显的亚硝酸盐次表层最大值现象并发现其分布和形成与叶绿素存在着一定的关系[34]。Brandhorst等在东北太平洋观察到亚硝酸盐次表层最大值现象并讨论了其形成机制,得出次表层亚硝酸盐最大值与沉积浮游物的再矿化和氧浓度非常低时硝酸盐的还原有关[35]。樊安德探讨了东海陆架沿岸区次表层亚硝酸盐最大值现象的生物活化机制,得出亚硝酸盐浓度明显相关于春、夏季浮游植物量,而秋季亚硝酸盐浓度仍有一定程度增长,与夏季出现于该海区的台湾暖流深层水沿陆架“斜坡”涌升的现象有关系[36]。刘纪勇等调查研究了南海神狐海域亚硝酸盐的垂直分布及其影响因素,猜测在100 m附近硝化作用较强及亚硝酸盐在此层位有较稳定的环境;另外,一定的pH、温度和溶解氧含量也可使亚硝酸盐浓度在次表层达到最大值[37]。近30年来对这种现象的观测与研究更是受到高度关注[38-40],众多观测研究业已表明,次表层亚硝酸盐出现最大值是大洋中一个普遍存在的现象。
2.3.2 磷酸盐、硅酸盐秋季西太平洋上层水体磷酸盐、硅酸盐的垂直分布如图 5所示。PO4-P的浓度变化范围为0.03~1.82 μmol·L-1,其平均含量为0.55 μmol·L-1。SiO3-Si的浓度变化范围为0.64~25.46 μmol·L-1,其平均浓度为4.45 μmol·L-1。

|
图 5 秋季赤道西太平洋上层水体磷酸盐、硅酸盐的垂直分布 Fig. 5 Vertical profiles of phosphate and silicate in the upper water of the equatorial Western Pacific Ocean in autumn |
在赤道西太平洋上层水体中,PO4-P、SiO3-Si具有和NO3-N相似的垂直分布。在100 m以浅含量较低,是由浮游植物的生物活动的消耗造成的。在100 m以深具有明显的垂直分层,且其含量随深度的增加均逐渐升高, 主要是有机质的矿化和氧化起主导作用。另外,在75 m以浅PO4-P断面内东侧浓度相对同层次较高,可能受南赤道流影响。在300 m(146°E~154°E)深度PO4-P、SiO3-Si含量高于同层其他区域浓度,可能是营养丰富的深层水涌升引起的。
2.3.3 溶解有机氮、磷2017年秋季赤道西太平洋表层到300 m层水体中各形态氮磷的平均含量及组成见表 1、2。从表 1中可以看出,对于该调查海区,表层到300 m层水体中DIN和TDN的平均含量均随深度增大逐渐升高,而DON的平均含量在垂向分布上含量相差不大。在100 m以浅水体中DON占TDN的比例较大(>50%),可能是微生物同化作用滞后于生产,导致DON的积累[41]。在100 m以深水体中,DON占TDN的比例逐渐降低,且AOU随水深逐渐增大,相关性分析进一步表明,该调查海域的100、150和300 m层水体中AOU与NO3-N(r=0.763 5、r=0.026 5、r=0.783 3)均呈正相关关系。由于100 m以深AOU与有机质的耗氧分解(此过程伴随着营养盐的释放)密切相关,这一结果表明该海域100 m以深水体中的有机质矿化这一生物化学作用是DO的主要控制因素,即100 m以深以微生物降解有机氮生成无机氮过程为主。
|
|
表 1 调查区域内各形态氮的平均含量及DON占TDN的比例 Table 1 The average concentration of different forms of nitrogen in the survey area and the ratio of DON to TDN |
|
|
表 2 调查区域内各形态磷的平均含量及DOP占TDP的比例 Table 2 The average concentration of different forms of phosphorus in the survey area and the ratio ofDON to TDP |
从表 2中可以看出,DIP与TDP平均含量的垂直分布趋势相似,随水深增加逐渐增大。DOP的平均含量则随深度逐渐减少,并且在150 m以深DOP减少到未检出。因为在真光层以上,浮游植物生长吸收DIP;在真光层以下,可见光强度变弱,浮游植物生长受到限制,微生物通过降解浮游植物碎屑和DOP生成DIP。另外,表层DOP在TDP中的占比相当,表层以深DOP在TDP中的占比随水深的增加而逐渐减少,表明磷营养要素在表层到300 m层的迁移过程中,伴随着强烈的DOP降解和DIP再生等转化作用。
赤道西太平洋属于热带,以高温、高盐、低营养盐为特点。据相关资料显示,寡营养盐海区可能占海洋真光层净出口产量的50%[42],而溶解有机氮(DON)、有机磷(DOP)组分作为贫营养盐海区营养盐储库的主要组成部分[43-44],可能为初级生产提供必要的营养来源[45],它们在温跃层上部的混合可显著影响营养盐的再生速率[43, 46-47]。
3 结论(1) 秋季NO3-N、PO4-P、SiO3-Si的垂直分布趋势大体相似:具有明显的垂直分层,且其含量随深度增加逐渐增大,符合大洋营养盐的一般规律。
(2) 秋季亚硝酸盐在75 m以浅和150 m以深水层浓度较低,在100 m水层附近出现最大值,主要与氨氧化细菌作用下的氨氧化过程或浮游植物的排泄释放有关。
(3) 研究区域内,DIN、TDN和DIP、TDP的平均含量均随水深逐渐增大;DON和DOP在TDP和TDN中的占比均随水深逐渐降低,高值出现在表层,低值在300 m层,反映了有机质的矿化作用对营养盐分布的影响。
| [1] |
Rothrock D A, Percival D B, Wensnahan M, et al. The decline in arctic sea-ice thickness: Separating the spatial, annual, and interannual variability in a quarter century of submarine data[J]. Journal of Geophysical Research, 2008, 113(C5): 763-763.
(  0) 0) |
| [2] |
Jiang M S, Chai F. Physical and biological controls on the latitudinal asymmetry of surface nutrients and pCO2 in the central and eastern equatorial Pacific[J]. Journal of Geophysical Research Oceans, 2005, 110(C6): 207-229.
(  0) 0) |
| [3] |
Borgne R L, Feely R A, Mackey D J, et al. Carbon fluxes in the equatorial Pacific: A synthesis of the JGOFS programme[J]. Deep Sea Research Part Ⅱ Topical Studies in Oceanography, 2002, 49(s 13-14): 2425-2442.
(  0) 0) |
| [4] |
李元龙.热带西太平洋温跃层水团时空特征及中小尺度海洋过程的作用[D].青岛: 中国科学院海洋研究所, 2012. Li Yunlong. Spatial and Temporal Variations of Thermocline Water Masses in the Western Tropical Pacific Ocean and the Effect of Mesoscale and Finescale Oceanic Processes[D]. Qingdao: Institute of Oceanography, Chinese Academy of Sciences, 2012. http://cdmd.cnki.com.cn/Article/CDMD-80068-1012411012.htm (  0) 0) |
| [5] |
宋金明. 赤道西太平洋部分海域上层水的海洋化学[J]. 海洋科学, 1996, 2: 40-44. Song Jinming. Marine chemistry on the upper water in the partial regions of the west equatorial Pacific[J]. Marine Sciences, 1996, 2: 40-44. (  0) 0) |
| [6] |
王凡, 张平, 胡敦欣, 等. 热带西太平洋环流及其季节变化[J]. 海洋通报, 2011, 46(23): 1998-2002. Wang Fan, Zhang Ping, Hu Dunxin, et al. The tropical western Pacific circulation and its seasonal changes[J]. Marine Notification, 2011, 46(23): 1998-2002. (  0) 0) |
| [7] |
马成璞, 王宗山, 邹娥梅. 西太平洋的海流特征[J]. 黄渤海海洋, 1983, 1(1): 20-32. Ma Chengpu, Wang Zongshan, Zou Emei. Characteristics of currents in the west Pacific ocean[J]. Journal of oceanography of Huanghai and Bohai Seas, 1983, 1(1): 20-32. (  0) 0) |
| [8] |
陈上及, 杜兵. 西赤道太平洋上层水水团的软划分[J]. 海洋学报, 1990, 12(4): 405-415. Chen Shangji, Du Bing. Soft division of upper water masses in the western equatorial Pacific[J]. Acta Oceanologica Sinica, 1990, 12(4): 405-415. (  0) 0) |
| [9] |
Wang F, Li Y L, Wang J N, et al. Intraseasonal variability of the surface zonal currents in the Western Tropical Pacific Ocean: characteristics and mechanisms[J]. Journal of Physical Oceanography, 2016, 46: 3639-3660. DOI:10.1175/JPO-D-16-0033.1
(  0) 0) |
| [10] |
Re id. On the total geostrophic circulation of the South PacificOcean: Flow patterns, traces and transports[J]. Progress in Oceanography, 1986, 16: 1-6. DOI:10.1016/0079-6611(86)90036-4
(  0) 0) |
| [11] |
Iskandar I, Masumoto Y, Mizuno K. Subsurface equatorial zonal current in the eastern Indian Ocean[J]. Journal of Geophysical Research, 2009, 114(C06005): 1-12.
(  0) 0) |
| [12] |
Kort V G, Burkov V A, Chekotillo K A. Recent data on the equatorial currents in the western part of the Pacific[J]. Doklady Akademii Nauk SSSR, 1996, 171: 337-339.
(  0) 0) |
| [13] |
Masuzawa J. Second cruise for CSK, Ryofu Maru, January to March 1968[J]. Oceanogr Mag, 1968, 20(2): 173-185.
(  0) 0) |
| [14] |
王召进. 太平洋海域赤道潜流的研究综述[J]. 海洋信息, 2012, 2: 37-44. Wang Zhaojin. A review of research on equatorial undercurrent in Pacific Ocean[J]. Marine Information, 2012, 2: 37-44. DOI:10.3969/j.issn.1005-1724.2012.02.006 (  0) 0) |
| [15] |
陈锦年, 吕新艳, 胡敦欣. 赤道太平洋潜流变化特征及其与异常海温东传[J]. 水科学进展, 2005, 16(6): 792-798. Chen Jinnian, Lv Xinyan, Hu Dunxin. Variable properties of the equatorial undercurrent in the Pacific and its anomalous warm water eastward propagation[J]. Advances in Water Science, 2005, 16(6): 792-798. DOI:10.3321/j.issn:1001-6791.2005.06.007 (  0) 0) |
| [16] |
何魁荣. 中太平洋西部赤道潜流的水文分析[J]. 东海海洋, 1991, 9(1): 19-25. He Kuirong. Hydrologic analysis of the equatorial undercurrent in the western central Pacific[J]. Donghai Marine Science, 1991, 9(1): 19-25. (  0) 0) |
| [17] |
Tsuchiya M, Lukas R, Fine R A, et al. Source waters of the Pacific equatorial undercurrent[J]. Progress in Oceanography, 1989, 23(2): 101-147.
(  0) 0) |
| [18] |
Mcphaden M J. The equatorial undercurrent: 100 years of discovery[J]. Transactions American Geophysical Union, 1986, 67(40): 762-765. DOI:10.1029/EO067i040p00762
(  0) 0) |
| [19] |
Johnson G C, Sloyan B M, Kessler W S, et al. Direct measurements of upper ocean currents and water properties across the tropical Pacific during the 1990s[J]. Progress in Oceanography, 2002, 52(1): 31-61.
(  0) 0) |
| [20] |
GB 17378. 4-2007.海洋监测规范[S].北京: 中国标准出版社, 2007. GB 17378. 4-2007. Marine Monitoring Specifications[S]. Beijing: Standards Press of China 2007. (  0) 0) |
| [21] |
Grasshorf K, Kremling K. Method of Seawater Analysis[M]. New York: John Wiley & Sons, 1999.
(  0) 0) |
| [22] |
吕艳, 王庆业. 太平洋赤道潜流起源的模式研究[J]. 广东海洋大学学报, 2009, 29(4): 58-62. Lv Yan, Wang Qingye. A study on a model of origin of Pacific equatorial undercurrents[J]. Journal of Guangdong Ocean University, 2009, 29(4): 58-62. DOI:10.3969/j.issn.1673-9159.2009.04.013 (  0) 0) |
| [23] |
景振华. 海流原理[M]. 北京: 科学出版社, 1996: 180-186. Jing Zhenhua. Current Principle[M]. Beijing: Science Press, 1996: 180-186. (  0) 0) |
| [24] |
董良, 李丽, 梁慧, 等. 2008年冬季西太平洋表层海水浮游藻类分布特征—分子有机地球化学研究[J]. 海洋地质与第四纪地质, 2012, 32(1): 51-59. Dong Liang, Li Li, Liang Hui, et al. Phytoplankton distribution in surface water of Western Pacific during winter o the 2008—a study of molecular organic geochemistry[J]. Marine Geology and Quaternary Geology, 2012, 32(1): 51-59. (  0) 0) |
| [25] |
蓝淑芳. 155°E断面夏季温、盐度的基本特征[J]. 海洋科学集刊, 1999, 41: 1-11. Lan Shufang. The basic characteristics of summer temperature and salinity of 155°E section[J]. Studia Marina Sinica, 1999, 41: 1-11. (  0) 0) |
| [26] |
Tsuchiya M. The origin of the Pacific Equatorial 13℃ Water[J]. Journal of Physical Oceanography, 1981, 11: 794-812. DOI:10.1175/1520-0485(1981)011<0794:TOOTPE>2.0.CO;2
(  0) 0) |
| [27] |
Katsumi H, Hitomi K. Vertical nutrient distributions in the Western North Pacific Ocean: simple model forestimating nutrient upwelling, export flux and consumption Rates[J]. Journal of Oceanography, 2003, 59: 149-161. DOI:10.1023/A:1025535003841
(  0) 0) |
| [28] |
张文全, 王保栋, 韦钦胜, 等. 春季东印度洋次表层亚硝酸盐最大值的分布特征及影响因素[J]. 海洋科学进展, 2016, 34(3): 403-410. Zhang Wen-quan, Wang Bao-dong, Wei Qin-sheng, et al. Spatial distribution of primary nitrite maximum and its influencing factors in the eastern Indian Ocean in spring[J]. Progress of Marine science, 2016, 34(3): 403-410. DOI:10.3969/j.issn.1671-6647.2016.03.010 (  0) 0) |
| [29] |
Zafiriou O C, Ball L A, Hanley Q, et al. Trace nitrate in oxic waters[J]. Deep Sea Research Part A: Oceanographic Research Papers, 1992, 39(7): 1329-1347.
(  0) 0) |
| [30] |
Lipschultz F. Nitrogen-specific up take rates of marine phytoplankton isolated from natyral populations of particles by flow cytometry[J]. Marine Ecology Progress Series, 1995, 123(1): 245-258.
(  0) 0) |
| [31] |
Lomas M W, Lipschultz F. Forming the primary nitrite maximum: Nitrifiers or phytoplankton?[J]. Limnology and Oceanography, 2006, 51(5): 2453-2467. DOI:10.4319/lo.2006.51.5.2453
(  0) 0) |
| [32] |
Olson R J. N-15 tracer studies of the primary nitrite maximum[J]. Journal of Marine Research, 1981, 39(2): 203-226.
(  0) 0) |
| [33] |
Dore J E, Karl D M. Nitrification in the euphotic zone as a source for nitrite, nitrate, and nitrous oxide at Station ALOHA[J]. Limnology and Oceanography, 1996, 41(8): 1619-1628. DOI:10.4319/lo.1996.41.8.1619
(  0) 0) |
| [34] |
Wooster W S, Chow T J, Barrett I, et al. Nitrite distribution in Peru Current water[J]. Journal of Marine Research, 1965, 23(3): 210-221.
(  0) 0) |
| [35] |
Brandhorst W. Nitrification and denitrification in the eastern tropical North Pacific[J]. Journal du Conseil, 1959, 25(1): 3-20. DOI:10.1093/icesjms/25.1.3
(  0) 0) |
| [36] |
樊安德. 东海陆架近岸区NO2-N最大值现象的生物活化机制探讨[J]. 海洋学报, 1987, 9(6): 766-773. Fan Ande. Discussion on the biological activation mechanism of NO2-N maximal phenomenon in coastal zone of the East China Sea[J]. Acta Oceanologica Sinica, 1987, 9(6): 766-773. (  0) 0) |
| [37] |
刘纪勇, 刘梓锐, 杨天邦, 等. 南海神狐海域亚硝酸盐垂直分布特征及影响因素[J]. 海洋地质前沿, 2017, 33(12): 7-12. Liu Jiyong, Liu Zirui, Yang Tianbang, et al. Vertical distribution pattern and influence factors of nitrite in the Shenhu area, south China sea[J]. Marine Geology Frontiers, 2017, 33(12): 7-12. (  0) 0) |
| [38] |
Collos Y, Slawyk G. Ammonium and nitrate in the tropical and equatorial Atlantic: Relationswith the primary nitrite maximum[J]. Marine Biology Letters, 1983, 4(5): 295-308.
(  0) 0) |
| [39] |
Mackey K R M, Bristow L, Parks D R, et al. The influence of light on nitrogen cycling andthe primary nitrite maximum in a seasonally stratified sea[J]. Progress in Oceanography, 2011, 91(4): 545-560. DOI:10.1016/j.pocean.2011.09.001
(  0) 0) |
| [40] |
Santoro A E, Sakamoto C M, Smith J M, et al. Measurements of nitrite production in andaround the primary nitrite maximum in the central California Current[J]. Biogeosciences, 2013, 10(11): 7395-7410. DOI:10.5194/bg-10-7395-2013
(  0) 0) |
| [41] |
Laura L, Gordon T, Dennis A, et al. Spatial and seasonal variability of dissolved organic matter in the Cariaco Basin[J]. Journal of Geophysical Research, 2013, 118: 951-962.
(  0) 0) |
| [42] |
Emerson S P, Quay DM, Karl C, et al. Experimentaldeterminationof the organiccarbon flux from open-oceansurface waters[J]. Nature, 1997, 389: 951-954. DOI:10.1038/40111
(  0) 0) |
| [43] |
Karl DM, Tien G, Dore J, et al. Total dissolved nitrogen and phosphorus concentrations at US-JGOFS Station Aloha: Redfield reconciliation[J]. Marine Chemistry, 1993, 41: 203-208. DOI:10.1016/0304-4203(93)90120-D
(  0) 0) |
| [44] |
Jackson G A, Williams P W. Importance of dissolved organic nitrogen and phosphorus to biological nutrient cycling[J]. Deep-Sea Research, 1985, 32(2): 223-235. DOI:10.1016/0198-0149(85)90030-5
(  0) 0) |
| [45] |
Berman T, Chava S. Algal growth on organic compounds as nitrogen sources[J]. Journal of Plankton Research, 1999, 21: 1423-1437. DOI:10.1093/plankt/21.8.1423
(  0) 0) |
| [46] |
Williams P J L. Evidence for the seasonal accumulation of carbon-rich dissolved organic material, its scale in comparison with changes in particulate material and the consequential effect on net C/N assimilation ratios[J]. Marine Chemistry, 1995, 51: 17-29. DOI:10.1016/0304-4203(95)00046-T
(  0) 0) |
| [47] |
倪建宇, 刘小骐, 赵宏樵, 等. 北太平洋中低纬度海区水体中营养盐的分布特征[J]. 海洋地质与第四纪地质, 2011, 31(2): 11-19. Ni Jianyu, Liu Xiaoqi, Zhao Hongqiao, et al. Nutrients distribution in the middle-to-low latitude zone of north Pacific[J]. Marine Geology and Quaternary Geology, 2011, 31(2): 11-19. (  0) 0) |
 2019, Vol. 49


