近年来,北冰洋海冰覆盖的面积不断下降,开阔水域不断增大,北极海冰变化特征及其影响因素逐渐受到关注。Bader等[1]在现有观测数据和数值模式的基础上,甚至预测2040年北冰洋夏季海冰完全消失。大量研究表明,热力和动力原因,是北极海冰快速减少的机制。热力方面,冰—海反照率正反馈机制触发,海冰反照率远大于开阔水域,海冰面积与开阔水域此消彼长,导致北冰洋反照率降低,增加了太阳辐射的吸收,加剧了海冰的融化[2];动力方面,北极涛动、北极偶极子异常等大气环流和海洋环流动力过程,对海冰的输送有重要作用[3]。
北极地区海陆分布复杂,影响海冰变化的气候因子不尽相同,不同海区海冰变化特征产生差异。中国不同学者分别针对格陵兰海[4]、楚科奇海[5]、东西伯利亚海[6]、北太平洋扇区[7]、拉普捷夫海[8]等海区,研究了相应海冰面积的变化特征,并分析了与温度场、风场、北极涛动等因素之间的关系。此外,更多研究集中对整个北极地区的海冰变化特征进行分析,汪代维和杨修群[9]以及国外学者[10-11]指出巴伦支海和格陵兰海是冬季北极海冰面积异常变化的最重要区域。
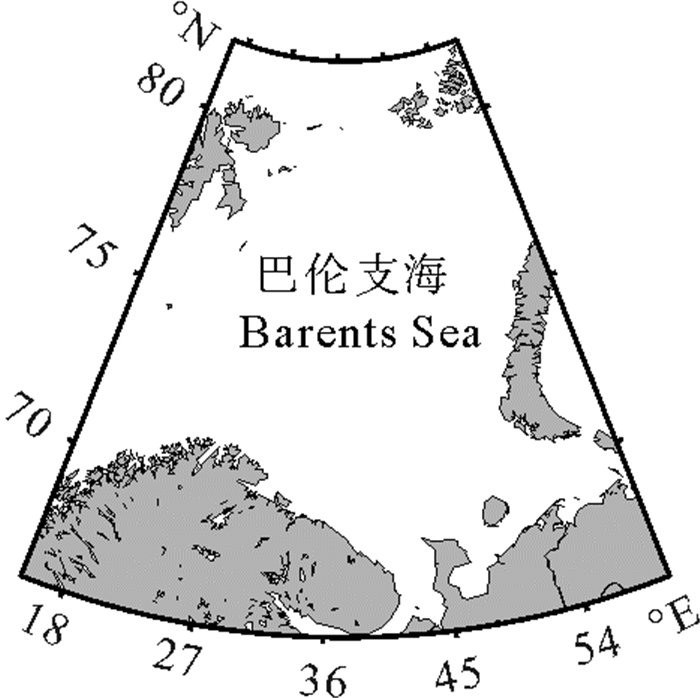
巴伦支海位于大西洋东侧(见图 1),是大西洋海水进入北冰洋重要通道,因而成为受到外来暖水影响最显著的海域[5, 11]。巴伦支海冬季大部分海域被海冰覆盖,夏季海冰融化形成大面积开阔水域,海冰范围季节变化明显。Lien等[11]通过分析1993年冬季巴伦支海东北部海冰范围异常减少现象,认为风驱大西洋暖水输送机制是该年海冰骤减的直接原因;Herbaut等[12]利用冰海模式模拟了不同风场对海冰分布的影响,解释了1979—2012年冬季巴伦支海北部和东部海冰变化不同的原因;Fritzner和Sagerup[13]采用ECMWF海冰密集度数据通过极值统计分析,认为正态分布对海冰外缘线位置拟合最好;Yang等[14]研究了巴伦支海11月海冰面积与2月北极涛动之间的关系,认为北极涛动减弱是冬季海冰面积减少的部分原因。
|
图 1 巴伦支海地理位置 Fig. 1 Geographical location of the Barents Sea |
目前中国极地考察主要集中在北太平洋扇区,以往单独针对巴伦支海海冰面积的研究资料相对较少。本文基于1900—2010年ECMWF海冰密集度等数据,着重分析巴伦支海海冰面积和密集度等参数的长期变化趋势,研究其变化特征和规律,并进一步分析海冰变化特征与海面温度、风场及北极涛动等气候因子之间的联系,对浮式平台开发冰区油气资源提供初步参考的依据。
1 数据和方法巴伦支海海冰密集度(Sea Ice Concentration,SIC)数据来自欧洲中期天气预报中心(European Centre for Medium-Range Weather Forecasts,ECMWF)ERA-20C月平均数据集,时间范围为1900—2010年,网格分辨率0.25°×0.25°,该月平均海冰密集度均为每6 h/d的平均值。ERA-20C数据集与美国冰雪数据中心SSM/I数据集和日本高级微波扫描辐射计AMSR-E数据集等来源相比,通过数值模拟和数据同化,时间尺度跨度更大,海冰密集度时间序列更长,更适合研究巴伦支海海冰长期变化特征。海冰密集度为单位海洋面积中海冰所占的比例,表征海冰的空间分布情况,本文用0~1表示,0表示开阔水域,1代表完全结冰。
风场和温度场(Sea Surface Temperature,SST)资料也均来源于ERA-20C月平均数据集,时间尺度和网格分辨率均与海冰密集度相同。北极涛动(Arctic Oscillation,AO)数据来源于美国国家大气研究中心(National Center for Atmospheric Research,NCAR),时间范围为1900—2010年。
本文主要采用经验正交函数(EOF)分解、线性回归和相关分析等统计方法,并根据以往关于巴伦支海海冰研究资料[11-13],定义海域15°E~60°E,66°N~82°N为巴伦支海海冰变化特征研究区域(见图 1)。
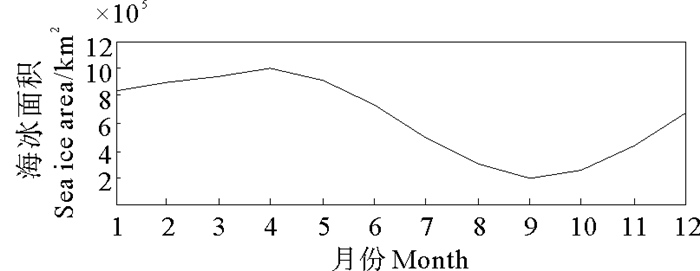
2 巴伦支海海冰多年变化 2.1 海冰年平均面积变化及趋势计算海冰面积时,一般以密集度15%等值线作为海冰的外缘线[15],因此,海冰密集度大于15%的海域总面积可定义为海冰范围,该范围内海冰净面积定义为海冰面积。根据ECMWF海冰密集度资料,计算出了1900—2010年海冰年月平均面积(见图 2)。
|
图 2 海冰面积逐月变化 Fig. 2 Average sea ice area of every month |
从图 2可以看出,海冰面积具有明显的季节变化。巴伦支海4月份海冰面积最大,9月份最小,而整个北极地区海冰3月份海冰面积最大,9月份最小[2],最大面积提前一个月。可以认为,5—8月为融冰期,10月至翌年3月为结冰期。
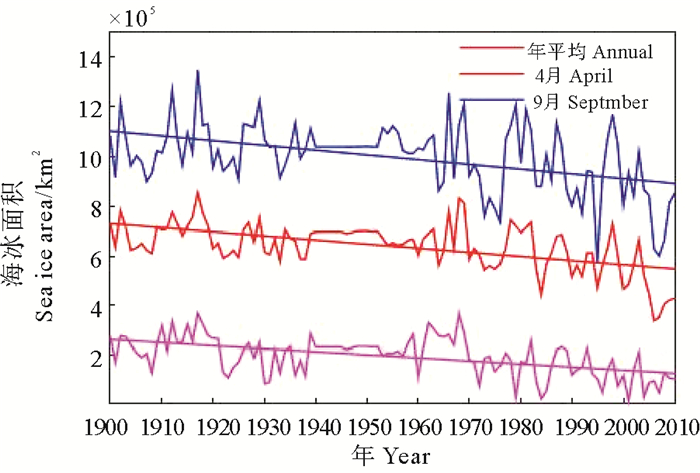
图 3展示了1900—2010年海冰年平均面积、4月份年平均面积和9月份年平均面积的变化及趋势,图中拟合直线由线性回归得到,其面积每年变化速率分别为-1 653、-1 925和-1 231 km2。而Su等[7]指出北太平洋扇区(125°E~120°W,50°N~80°N)海冰面积每年约减少1 565 km2,由此可见,巴伦支海海冰面积减少速率略大于北太平洋扇区,海冰融化现象更为明显。
|
图 3 年平均、4和9月海冰面积变化 Fig. 3 Sea ice area of averaged annual, April and September |
巴伦支海海冰年平均面积距平如图 4所示,整体呈现出正负距平交替特征,1969年以前以正距平为主,此后主要为负距平。1969年以前,距平基本持续为正位相,可认为在1900—2010年间,冰情属于偏重冰年或重冰年,如1909—1919年、1926—1928年和1939—1953年;1969年以后,也先后出现距平为正的年份,冰情属于偏重冰年或重冰年,如1977—1982年、1987—1988年、1998年和2003年;这些年份海冰开始融化时间较晚,而全面冻结时间较早,年平均海冰面积较大。1969年以后,距平为负的年份,可认为1900—2010年内,属于偏轻冰年或者轻冰年。其余年份海冰面积正负距平交替,可以认为是冰情中等的年份。

|
图 4 年平均海冰面积距平 Fig. 4 Anomaly of averaged annual sea ice area |
以上分析可以看出,巴伦支海海冰呈现出先重后轻的特征,体现了海冰面积持续减少的过程。而在1987—1988年、1998年和2003年等偏重冰年或重冰年前后,冰情都相对较轻,2004年以后冰情逐渐减轻,巴伦支海轻冰年与北极轻冰年大致相同。李涛等[6]指出,轻冰年为北冰洋整体增暖而产生的共同特征,而重冰年因不同海域暖水热源不同而产生差异。
2.3 海冰密集度多年变化趋势巴伦支海海冰外缘线位置季节变化较大,海冰密集度分布特征有明显的季节变化。冬季(12月—翌年2月)和春季(3—5月),巴伦支海北部存在高密集度冰区,密集度达到0.9,海冰向低纬度辐散,研究区域东南部海冰大面积出现;夏季(6—8月)和秋季(9—11月),海冰大幅度消退,原高密度冰区大部分区域海冰密集度降至0.8以下,出现不同程度的融化,东南部海冰几乎全部消失。限于篇幅,本文以1、4、7和10月为代表,展现了1900—2010年海冰平均密集度的分布(见图 5)。

|
图 5 海冰密集度变化 Fig. 5 Temporal distributions of sea ice concentration |
图 6体现了巴伦支海海冰密集度的变化趋势。不同月份巴伦支海海冰主要变化区域可能不同,通过海冰密集度线性回归,结果显示,1—3月海冰密集度变化区域主要集中在巴伦支海中部偏东区域,4—5月主要集中在中部海域,7—9月主要集中在海域东北部,10—12月主要集中在海域西北部,整体上呈现“中部偏东—中部—东北部—西北部—中部偏东”转移特点,区域密集度年均减少速率甚至在0.006以上,即该海域网格点处海冰密集度每年降低0.6%。虽然局部海域海冰密集度有增长趋势,但是总体上,巴伦支海海冰密集度呈现降低趋势。

|
图 6 海冰密集度趋势 Fig. 6 Trends of sea ice concentration |
为了进一步分析上述巴伦支海海冰密集度变化的水平分布特征和影响因素,运用EOF方法对1900—2010年海冰密集度进行分解,然后用North[16]准则检验分解结果。
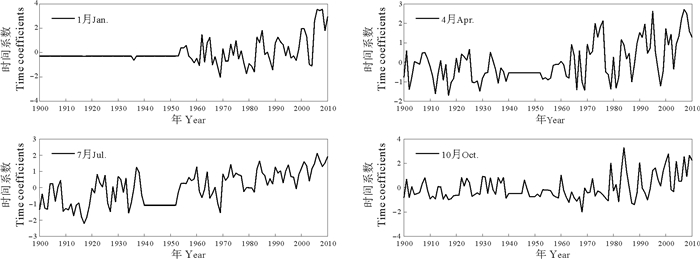
结果显示,前两个EOF模态得到较好的分离。第一主模态EOF1(方差贡献率高于40%)整体反应出巴伦支海海冰密集度变化的主要空间分布特征(见图 7)。第二模态EOF2(图略),呈现“跷跷板”现象,体现了局部海域海冰密集度有反位相变化趋势。EOF1全场为单极值同位相分布,且极值区域与海冰密集度变化明显区域基本吻合,说明了巴伦支海海冰密集度呈现降低趋势。陈明轩等[4]指出用EOF1的时间系数序列(见图 8)来研究海冰变化及其与其他气候因子的关系具有一定的合理性。

|
图 7 海冰密集度EOF分解的第一主模态 Fig. 7 The first leading EOF patterns of sea ice concentration |
|
图 8 海冰密集度EOF分解的第一主成分 Fig. 8 The first leading EOF principal components of sea ice concentration |
巴伦支海南接北大西洋,北邻北冰洋,同时受到暖流和冷流的作用,因此,需要分析巴伦支海海冰密集度变化与海温的关系。
本文采用EOF1的时间系数序列与每个格点海面温度序列做相关分析,相关系数等值线图如图 9所示。在年平均密集度减少大于0.006的海域,EOF1时间系数与海温的相关系数达到0.8以上,为高度相关;在年平均密集度减少0.002~0.006的海域,相关系数在0.5~0.8之间,为显著相关,相关性均通过了显著性水平为0.05的显著性检验。较高的相关系数,揭示出在密集度变化较大区域,海冰对海温变化具有较高的敏感性,海温上升,引起海冰融化,海冰密集度降低,海冰面积降低。

|
图 9 海冰密集度EOF1时间系数与海面温度的相关系数 Fig. 9 Correlation coefficients between the first leading EOF time coefficients and Sea Surface Temperature |
风场对海冰变化的影响虽然弱于气温,但也是影响海冰密集度,尤其是海冰低密集度冰区不可忽视的气候因素。
在以往研究[5, 8]中,将风场分解为纬向风和经向风,研究短时间内两种风向对海冰面积的影响。本文将EOF1的时间系数序列分别与纬向风、经向风和总风速3种序列进行相关性分析。结果显示,在密集度减少较大区域,纬向风和经向风与EOF1时间系数的相关系数均小于0.25,相关性较低;总风速与EOF1时间系数的相关系数相对较高,均通过了显著性水平为0.05的显著性检验。总风速与EOF1时间系数的相关系数等值线图如图 10所示,具体为每月平均密集度减少0.002~0.004的海域,两者相关系数基本上在0.3~0.5之间;1月、2月、4月、6—9月,平均密集度减少大于0.004的海域,两者相关系数基本上在0.5~0.6之间,为高度相关;其余月份及其他变化区域相关性较低。

|
图 10 海冰密集度EOF1时间系数与总风速的相关系数 Fig. 10 Correlation coefficients between the first leading EOF time coefficients and total wind speed |
海冰容易因风场变化而在短时间内产生快速响应,而海面温度的影响则是一个缓慢的积累效应。风场对海冰密集度的影响,可能由于风驱动下导致海冰相互挤压,海冰的运动与风的驱动有所差异,无法很好地随风流动,因而风场与密集度的相关系数较之海面温度较低。
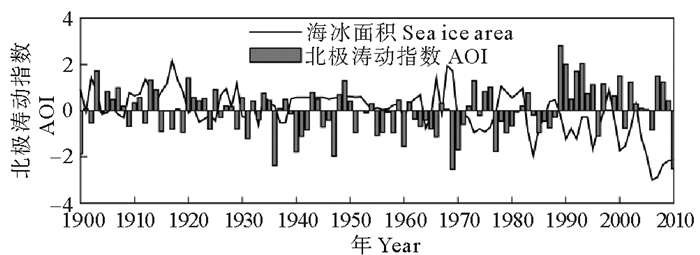
3.4 海冰变化与北极涛动的关系北极涛动(AO)是北极地区大气环流的重要气候指数,是北半球中高纬度大气环流的主导模态,具体为是指20°N以北海平面气压场EOF分解的第一模态,其时间系数称为北极涛动指数(AOI)。本文把巴伦支海海冰年平均面积距平与AOI进行相关分析,相关系数分别为-0.26,通过了显著性水平为0.05的显著性检验,呈现负相关(见图 11)。
|
图 11 海冰面积距平与北极涛动的联系 Fig. 11 Relation between sea ice area anomaly and AO |
AO为正位相时,海冰面积持续减小,冰情较轻;AO为负位相时,海冰面积逐渐增大,冰情较为严重,1969年以后,该现象尤为明显。研究指出[17],AO正位相时,北极与中纬度的气压差增大,中纬度西风急流加强,极区冷空气向南扩展时受到限制;AO负位相时,气压差减弱,中纬度西风减弱,冷空气较易向南侵袭。因此,AO出现正位相时,冰情因冷空气受限而较轻,AO出现负位相时,冰情因冷空气南下而加重,AO可以位相可以作为判别巴伦支海冰情的参数。
4 结论本文利用欧洲中期天气预报中心1900—2010年巴伦支海海冰密集度等数据,分析了巴伦支海海冰多年变化特征,并初步分析了变化的原因,得到如下结论:
(1) 巴伦支海海冰面积具有明显的季节变化,4月最大,9月最小,年平均面积每年约减少1 653 km2,冰情先重后轻,海冰呈现减少趋势。
(2) 巴伦支海海密集度变化趋势较大区域逐月不同,首次发现了整体上呈现出“中部偏东—中部—东北部—西北部—中部偏东”转移特点,密集度逐年减少甚至高于0.006。
(3) 巴伦支海海冰密集度变化的空间特征,可由海冰变化的EOF第一主模态表示。海冰密集度减少较大区域,与海面温度呈显著相关甚至高度相关,与总风速场呈相关性略低,对温度变化的敏感性高于风场;与总风速的相关性高于纬向风和经向风;海冰面积和范围与AO呈负相关,AO正位相时,海冰面积持续减小,AO负位相,海冰面积逐渐增大。
掌握巴伦支海海冰时空变化特征,对浮式平台在该海域勘探和开采石油、天然气等工作,提前进行冰区区域划分和作业时间及作业区域的确定,具有一定的工程指导意义。
| [1] |
Bader J, Mesquita M D S, Hodges K I, et al. A review on Northern Hemisphere sea-ice, storminess and the North Atlantic Oscillation: Observations and projected changes[J]. Atmospheric Research, 2011, 101(4): 809-834. DOI:10.1016/j.atmosres.2011.04.007
(  0) 0) |
| [2] |
Curry J A, Schramm J L, Ebert E E. Sea ice-albedo climate feedback mechanism[J]. Journal of Climate, 1995, 8(2): 240-247. DOI:10.1175/1520-0442(1995)008<0240:SIACFM>2.0.CO;2
(  0) 0) |
| [3] |
Wang J, Zhang J, Watanabe E, et al. Is the Dipole Anomaly a major driver to record lows in Arctic summer sea ice extent?[J]. Geophysical Research Letters, 2009, 36(5): 277-291.
(  0) 0) |
| [4] |
陈明轩, 徐海明, 管兆勇. 春季格陵兰海冰变化及与北大西洋涛动和北极涛动的联系[J]. 南京气象学院学报, 2003, 26(4): 433-446. Chen M X, Xu H M, Guan Z Y. Interdecadal variations of spring greenland sea-ice extent and its relationships with North Atlantic and Arctic Oscillations[J]. Journal of Nanjing Institute of Meteorology, 2003, 26(4): 433-446. DOI:10.3969/j.issn.1674-7097.2003.04.001 (  0) 0) |
| [5] |
朱大勇, 赵进平, 史久新. 北极楚科奇海海冰面积多年变化的研究[J]. 海洋学报(中文版), 2007, 29(2): 25-33. Zhu D Y, Zhao J P, Shi J X. Sudy on the multi-year variations of sea ice cover of Chukchi Sea in Arctic Ocean[J]. Acta Oceanologica Sinica, 2007, 29(2): 25-33. DOI:10.3321/j.issn:0253-4193.2007.02.003 (  0) 0) |
| [6] |
李涛, 赵进平, 朱大勇. 1997—2005年北极东西伯利亚海海冰变化特征研究[J]. 冰川冻土, 2009, 31(5): 822-828. Li T, Zhao J P, Zhu D Y. Variations of sea ice cover in East Siberian Sea of Arctic Ocean in 1997—2005[J]. Journal of Glaciology and Geography, 2009, 31(5): 822-828. (  0) 0) |
| [7] |
Su J, Wei J, Li X, et al. Sea ice area inter-annual variability in the Pacific sector of the Arctic and its correlations with oceanographic and atmospheric main patterns[C].//The Twenty-first International Offshore and Polar Engineering Conference. Hawaii: [s.n.], 2011: 962-967.
(  0) 0) |
| [8] |
姚文峻, 赵进平. 北极拉普捷夫海海冰多年变化研究[J]. 极地研究, 2013, 25(3): 218-225. Yao W J, Zhao J P. Study on multiyear variations of sea ice in the Laptev Sea of the Arctic Ocean[J]. Chinese Journal of Polar Research, 2013, 25(3): 218-225. (  0) 0) |
| [9] |
汪代维, 杨修群. 北极海冰变化的时间和空间型[J]. 气象学报, 2002, 60(2): 129-138. Wang D W, Yang X Q. Study on multiyear variations of sea ice in the Laptev Sea of the Arctic Ocean[J]. Acta Meteorologica Sinica, 2002, 60(2): 129-138. (  0) 0) |
| [10] |
Onarheim I H, Eldevik T, Årthun M, et al. Skillful prediction of Barents Sea ice cover[J]. Geophysical Research Letters, 2015, 42(13): 5364-5371. DOI:10.1002/2015GL064359
(  0) 0) |
| [11] |
Lien V S, Schlichtholz P, Skagseth Ø, et al. Wind-driven Atlantic water flow as a direct mode for reduced Barents Sea ice cover[J]. Journal of Climate, 2016, 30: 803-812.
(  0) 0) |
| [12] |
Herbaut C, Houssais M N, Close S, et al. Two wind-driven modes of winter sea ice variability in the Barents Sea[J]. Deep Sea Research Part I: Oceanographic Research Papers, 2015, 106: 97-115. DOI:10.1016/j.dsr.2015.10.005
(  0) 0) |
| [13] |
Fritzner S M, Sagerup T. Sea Ice Distribution in the Barents Sea[C].//Ocean, Offshore and Arcite Engineering Division ASME 2016 35th International Conference on Ocean, Offshore and Arctic Engineering. Busan, South Korea: [s.n.], 2016.
(  0) 0) |
| [14] |
Yang X Y, Yuan X, Ting M. Dynamical link between the Barents-Kara Sea Ice and the Arctic Oscillation[J]. Journal of Climate, 2016, 29(14): 5103-5122. DOI:10.1175/JCLI-D-15-0669.1
(  0) 0) |
| [15] |
Ogi M, Rigor I G, McPhee M G, et al. Summer retreat of Arctic sea ice: Role of summer winds[J]. Geophysical Research Letters, 2008, 35(24): 101-106.
(  0) 0) |
| [16] |
North G R, Bell T L, Cahalan R F, et al. Sampling errors in the estimation of empirical orthogonal functions[J]. Monthly Weather Review, 1982, 110(7): 699-706. DOI:10.1175/1520-0493(1982)110<0699:SEITEO>2.0.CO;2
(  0) 0) |
| [17] |
Thompson D W J, Wallace J M. The Arctic oscillation signature in the wintertime geopotential height and temperature fields[J]. Geophysical Research Letters, 1998, 25(9): 1297-1300. DOI:10.1029/98GL00950
(  0) 0) |
 2019, Vol. 49


