2. 青岛海洋科学与技术国家实验室海洋生态与环境科学功能实验室, 山东 青岛 266071;
3. 天津科技大学海洋与环境学院, 天津 300457
大气沉降和河流输入是海洋生态系统氮元素的主要外部来源[1],模式评估结果显示氮、磷等元素的大气沉降量与河流输入量相当,在某些海域甚至大于河流输入量[2-4]。由于经济的快速发展,人为氮氧化物的排放从1980—2000年增加了2.4倍[5]。已有研究表明,西北太平洋边缘海的大气硝酸盐沉降从1980—2003年增加了1.8~4.2倍[6]。Duce等[7]通过生态模型预测,到2030年时,中国近海以及西北太平洋的总大气氮沉降量会在2000年的基础上增加1.0~1.5倍。因此,大气沉降对海区氮循环及初级生产过程的贡献会越来越重要。
黄海位于中国大陆和朝鲜半岛之间,是典型的半封闭陆架海,平均水深44 m。黄海东、西沿岸大约有30多条河流注入,是黄海陆源物质的主要来源,但是对于远离陆地的黄海中部地区,河流的影响较弱,大气沉降是陆源物质向海洋输送的主要途径。Zhang等[8-9]通过观测发现,在西北太平洋近岸海区,包括黄海,尤其是在真光层,由于垂直输运较弱,与河流输送相比,大气沉降已经是黄海营养盐的主要来源之一。此外,Zhang等[10]通过在千里岩岛和嵊泗列岛的观测,定量估算了西北太平洋边缘海和陆架海的大气沉降量,认为大气沉降对海洋溶解无机氮(DIN)的贡献与河流输入同样重要;并且指出大气沉降对西北太平洋近岸海域中的营养物质的生物地球化学循环有着重要作用。也有研究[11]估算黄海全年大气氮沉降量可达494 GgN/a,约是河流输入量的5倍。
大气沉降作为海洋生态系统中氮元素的主要外源[2-4],对海洋氮循环以及初级生产过程都具有重要影响。大气氮沉降会直接增加海洋氮储库,影响海洋中各营养盐(氮、磷等)含量和比例,以及氮循环路径和速率,改变浮游植物的营养盐限制状况,进而影响初级生产过程[1]。Qi等[11]基于海上站点的观测数据估算黄海的大气氮沉降通量,进而计算得出大气氮沉降可支持黄海0.3%~6.7%的初级生产力;也有研究[12]表明,在全年来看,来自大气沉降的氮支持了黄海17%~37%的新生产力;亚洲沙尘事件带来的营养盐沉降与黄海春季水华的强弱有明显的相关关系[13-15]。然而,由于海区自身营养盐状况的不同,且温度和光照也对浮游植物生长具有限制作用,导致大气沉降的氮不一定完全被浮游植物吸收,进而支持海区的初级生产,因而以往研究直接利用沉降量去估算对初级生产力的贡献往往存在高估。因此,本文利用三维物理-生物耦合模型来模拟大气氮沉降对南黄海主要初级生产过程的影响,并通过数值实验区分不同季节的大气氮沉降的贡献。
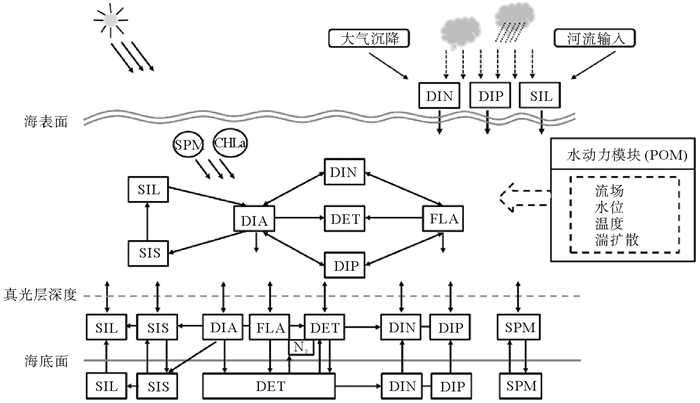
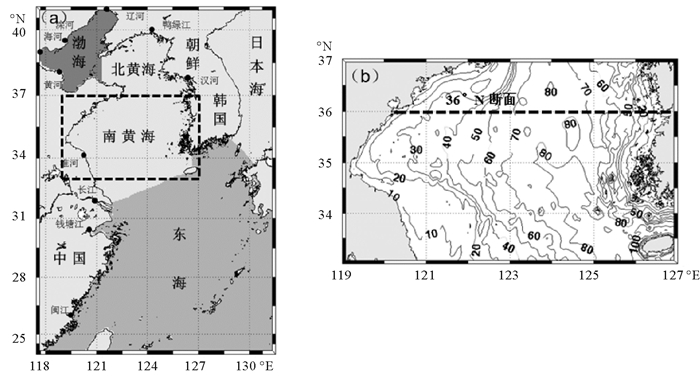
1 方法 1.1 物理-生态耦合模型本研究所运用的三维物理-生物耦合模型主要包括水动力模块和生物地球化学模块。水动力模块基于Princeton Ocean Model[16-17](POM),模拟区域范围为117.5°E~131.5°E,24.0°N~41.0°N,包括渤、黄、东海,以南黄海为主要研究区域(见图 1),为考虑海海界面和大河影响,将东海和渤海也包括在内。模型的空间分辨率均为1/18(°),垂直分为21层,对上混合层进行加密[18]。模型的生态模块(见图 2)基于NORWECOM[19-20],生态过程经过修改使得更适合中国海生态过程的特点[21]。生态模块变量包括:大型硅藻(DIA)和小型鞭毛藻(FLA)两种藻类,无机氮(DIN)、无机磷(DIP)和硅酸盐(SIL)三种主要营养盐,以及两种碎屑(碎屑DET和生物硅SIS)。水体中的生物过程包括:浮游植物光合作用生长、呼吸和死亡以及碎屑的再矿化,底栖层中的生物过程包括碎屑的矿化溶出、再悬浮等过程,此外还考虑浮游植物和碎屑从海表到海底的沉降过程以及营养盐的沉积物-水界面交换通量、河流输入和大气沉降。水动力模块为生态模块提供流场、垂直和水平湍流混合系数,用来计算各生态变量的对流输运和湍流混合;提供温度用来计算浮游植物生长、呼吸等过程的温度限制因子。
|
( (a)不同背景色表示不同大气氮沉降数据, 沿岸黑色点为河流入海口;(b)研究区域水深分布,单位为m,其中黑色虚线表示36°N断面。(a) Different background colors represent different atmospheric nitrogen deposition data the estuaries are denoted by black dots around the coastline the bathymetry of the research area. (b) The black dotted line is the 36° N section. ) 图 1 模型模拟区域(a)和研究区域(b) Fig. 1 Model domain (a) and research area (b) |
|
|
表 1 模型中大气氮沉降量的时空变化 Table 1 The temporal-spatial variation of atmospheric nitrogen deposition in the model domain |
物理模块的初始条件和开边界条件均来自大区的模拟结果[18],包括日均的环流、水温、盐度和海面动力高度等外洋信号和潮汐强迫;大气强迫为2015年日均的NCEP/DOE再分析资料(https://www.esrl.noaa.gov/psd/data/gridded/data.ncep.reanalysis.html),包括海表温度、降水、蒸发、气压、热通量和风应力;生态变量的初始条件和开边界条件来自WOA2005(World Ocean Atlas)数据集和已发表的多年观测资料[22];河流(主要的10条河流)对营养盐的输入来自已发表的观测资料(2015年河流泥沙公报)与已发表的观测结果[23-28];计算水中光强所需的悬浮颗粒物(SPM)资料来自SeaWiFS卫星数据(https://oceandata.sci.gsfc.nasa.gov/SeaWiFS/)。
大气沉降对海洋氮营养盐的输入主要来自已发表的多年观测资料[29-31],沉降种类分为干湿两种沉降,并以溶解性无机氮(DIN)形态进入海洋,包括硝酸盐(NO3-)和氨盐(NH4+)两种物质。由于观测资料有限,模型中只考虑了大气沉降量在时间和空间上的大概变化。空间上,考虑了渤海、黄海和东海(见图 1(a))沉降量的不同,同一海区内没有考虑空间差异。时间上,考虑了大气沉降的季节变化,同一季节内三个月大气沉降量相同。
1.3 模型实验本研究共包含5个模型实验,实验初始场、大气动力强迫、河流输入等均相同。模型在不加大气氮沉降的情况下运行两年,第二年末的结果作为所有数值实验的初始场。实验1为在此基础上继续运行一年,模拟得到不加大气氮沉降下2015年南黄海DIN和叶绿素浓度分布的季节变化;实验2为第三年添加大气氮沉降;实验3、4、5分别为第三年的冬、春、夏三个季节分别添加大气氮沉降(月均)。
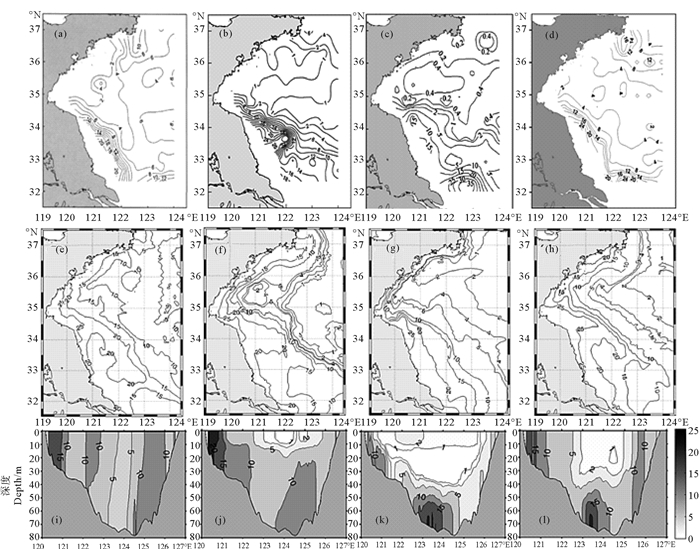
2 结果 2.1 南黄海无机氮和叶绿素浓度季节变化特征模型模拟得到东中国海物理场、DIN及叶绿素浓度分布的季节变化。其中,物理场的模拟结果在已发表文献中与实测结果进行了比较验证[32]。图 3为模拟得到的南黄海DIN浓度水平(以表层为例)和垂直(以36°N断面为例)分布的季节变化与观测资料[33-36]的对比。可以看出,受近岸河流的排放影响,近岸区域营养盐浓度四季都较高。春季,表层DIN沿岸海域浓度最大可以达到25.0 mmol/m3,由沿岸向黄海中部迅速减小,黄海中部表层由于春季浮游植物旺发消耗了大量营养盐,DIN浓度较低,小于5.0 mmol/m3(见图 3(b)、(f));断面上,黄海中部真光层内DIN浓度较低,下层水水体中DIN浓度高(见图 3(j))。夏季,由于水体层化加强,断面上可以看出营养盐跃层较春季有所加强,下层高DIN浓度海水难以向上补充,DIN浓度最小值出现在次表层,浓度小于1.0 mmol/m3(见图 3(k));表层DIN低浓度区域范围进一步扩大,浓度值进一步减小,小于2.0 mmol/m3(见图 3(c)、(g))。秋季,由于气温降低、海表风加强,促进了海洋垂直混合,底层富营养盐海水可以向上层海水补充,加之温度降低限制了浮游植物生长的吸收,表层DIN浓度与夏季相比明显增加(见图 3(d)、(h));断面上也可以看出营养盐跃层减弱,次表层DIN低值区基本消失(见图 3(l))。冬季,表层DIN浓度则达到了全年最大,黄海中部最大值可以达到5.0 mmol/m3,且低DIN区域范围是四季中最小(见图 3(a)、(e));断面上DIN浓度垂直分布趋向均匀(见图 3(i))。与实测对比可以看出,模型可以成功量化DIN的主要生消机制,模拟得到的季节变化特征与实测结果相吻合。近岸水深较浅区域,高DIN浓度范围要大于实际观测的结果,由于本研究主要分析黄海中部区域的两个重要初级生产过程(春季水华和次表层叶绿素最大值),模型对黄海中部的模拟结果准确性较高,因此以下基于模型结果的分析具有较高的可靠性。
|
( (a)、(b)、(c)、(d)分别表示2、5、8和11月的表层DIN实测数据;(e)、(f)、(g)、(h)分别表示2、5、8和11月的表层DIN模拟结果;(i)、(j)、(k)、(l)分别表示2、5、8和11月的36°N断面DIN模拟结果。(a)~(d) show the observations of surface DIN in February, May, August, and November, respectively; (e)~(h) show the horizontal model results of surface DIN in February, May, August, and November, respectively; (i)~(l) show the vertical model results of DIN in the 36°N section in February, May, August, and November, respectively. ) 图 3 南黄海表层以及36°N断面DIN季节变化(单位:mmol/m3) Fig. 3 The seasonal variations of DIN concentrations in the surface of the Southern Yellow Sea and in the 36 ° N section(Unit: mmol/m3) |
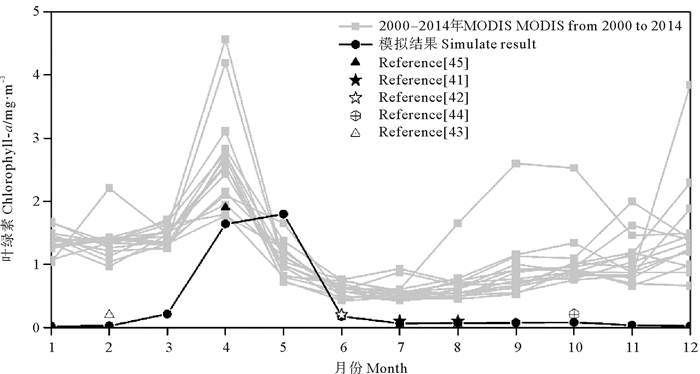
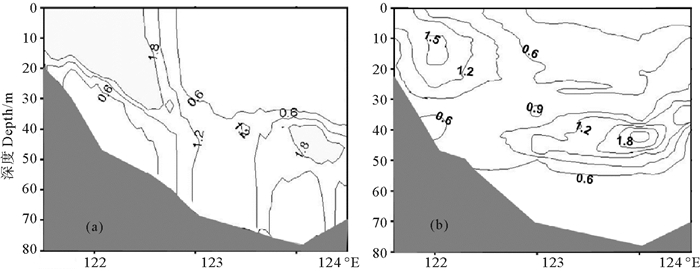
南黄海中部春季表层浮游植物水华和夏季次表层叶绿素最大值现象是两个重要初级生产过程。图 4为模拟得到的黄海中部(34°N~36°N,123°E~125°E)表层叶绿素浓度的季节变化图(黑线),全年看来,叶绿素浓度峰值出现在4—5月,达1.5 mg/m3,其余月份浓度较低,模型成功再现黄海中部春季水华现象。MODIS反演海表叶绿素浓度数据(灰线)也明显看出叶绿素浓度在春季的峰值。但在秋冬季节,MODIS反演结果明显大于模拟结果,这是由于卫星反演的叶绿素浓度受水体中碎屑和有色溶解有机物质等的影响[37],反演值偏高。尤其是在秋冬季节,由于海表降温和大风影响,水体垂直混合增强,水体中悬浮物浓度增高,导致卫星反演叶绿素浓度很高,而此时低水温限制了浮游植物,实际水中叶绿素浓度很低,因此卫星反演结果在一定程度上存在高估[38-40]。图 4中不同标记分别代表已发表的黄海中部现场观测的叶绿素浓度数据[41-45],可以发现,模拟结果与现场观测基本一致。夏季(见图 5),模型模拟得到的叶绿素垂直分布可以看出(见图 5(a)),除近岸区域由于陆源营养盐排放一直支持较高营养盐浓度(见图 3(k))和较高的生产力外,黄海中部区域上层水体由于营养盐在春季水华期间耗尽,限制了浮游植物生长,导致叶绿素浓度很低,小于0.4 mg/m3。黄海中部叶绿素浓度最大值出现见次表层,大概40 m水层,叶绿素浓度可达1.8 mg/m3,模拟结果与现场观测结果[46](见图 5(b))较为吻合。
|
图 4 黄海中部表层叶绿素浓度季节变化与卫星及观测数据对比 Fig. 4 The seasonal variations of the surface chlorophyll concentrations in the central Yellow Sea and the comparison with satellite and observation data |
|
( (a),(b)分别表示模式模拟结果和实测结果,单位:mg/m3。(a) and (b) show the model results and the observations, respectively. Unit: mg/m3. ) 图 5 夏季(8月)34.5°N断面叶绿素浓度垂向分布 Fig. 5 The vertical distributions of the chlorophyll concentrations in the 34.5°N section during summer (August)[37] |
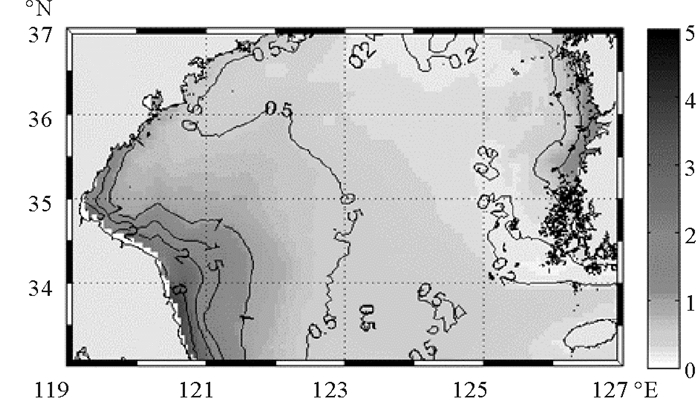
大气氮沉降的直接作用就是会增加海洋氮储库,其作用在表层尤为明显。图 6为考虑大气氮沉降下(实验2)表层DIN浓度与不考虑时(实验1)的年平均差值分布图。从图中可以看出,大气氮沉降导致的黄海表层DIN浓度变化量空间差异显著,近岸海域增加量较大,可以达到3.0 mmol/m3,由近岸海域到黄海中部海域呈明显的递减趋势。这一变化主要决定于原黄海营养盐分布。近岸海域,由于受人类活动影响,河流等营养盐来源众多,导致本身DIN浓度较高,相对于浮游植物生长吸收来说存有富余,故大气沉降的氮在此处不能被浮游植物生长吸收,其效果是显著增加此处DIN浓度。黄海中部区域,本身营养盐不足,尤其是在春季水华期间,大气沉降的DIN是此处营养盐的重要来源,能够及时被浮游植物吸收利用,几乎没有剩余,故从营养盐分布来看,黄海中部差值较小,小于0.5 mmol/m3。
|
图 6 添加大气氮沉降后黄海表层年均DIN浓度变化量水平分布(单位:mmol/m3) Fig. 6 The horizontal distribution of the variation in yearly mean surface DIN concentration after adding the atmospheric nitrogen deposition in the Yellow Sea (Unit: mmol/m3) |
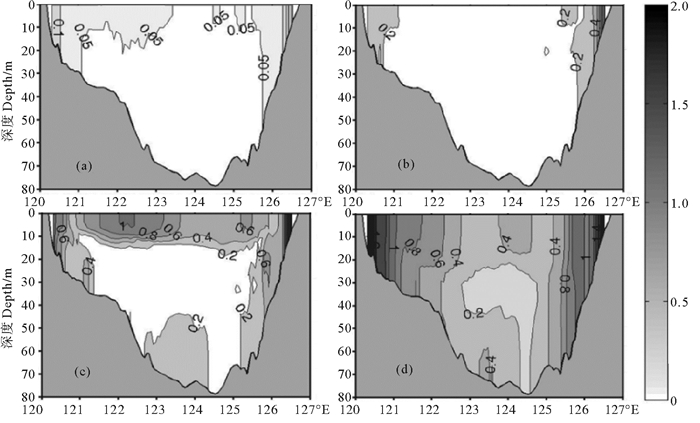
大气氮沉降进入海洋水体后,有一部分在海洋表层被浮游植物利用,剩余部分则会沉降影响到下层水体的DIN浓度。从两个实验的差值在36°N断面分布来看(见图 7),大气氮沉降引起36°N断面DIN浓度变化量具有较明显的季节差异,冬季(2月:见图 7(a))DIN浓度增加量水平和垂直方向都较为均匀,这是由于,浮游植物生长受到冬季低温的限制,因此不能吸收大气沉降的DIN,水体中DIN浓度的增加量基本与大气氮沉降量一致。春季(5月:见图 7(b))DIN浓度在近岸海域增加明显,且由于冬季大气沉降的累积作用,春季近岸的增加量较冬季增大;而黄海中部区域,由于春季水华过程消耗了大量DIN,使得上层水体中冬季和春季沉降的DIN都被利用,图 7(b)中显示两实验DIN浓度的变化并不明显。夏季(8月:见图 7(c))DIN浓度在表层增加多(最大1.0 mmol/m3),而次表层增加少,这是由于夏季表层水体中限制浮游植物生长的营养盐为无机磷,DIN相对富余,模型结果显示此时表层氮磷比约为40,大气沉降下来的DIN在表层不被浮游植物所消耗而存留;在次表层,氮磷比较小,约为10,大气沉降的氮到达此处被吸收,支持了次表层叶绿素最大值现象,故两个实验DIN浓度在次表层几乎没差别。秋季(11月:见图 7(d)),由于水体垂直混合增强,DIN浓度的变化量垂向分布均匀,温度降低使得浮游植物生长较弱,大气沉降的氮累积下来,并被强混合带到下层水体;近岸水域由于全年沉降的氮都得不到利用,累积最为明显,增加量可达2.0 mmol/m3。
|
( (a)、(b)、(c)、(d)分别表示2、5、8和11月的模拟结果。(a), (b), (c), and (d) show the model results in February, May, August, and November, respectively. ) 图 7 添加大气沉降后36°N断面DIN变化量垂向分布(单位:mmol/m3) Fig. 7 The vertical distributions of the variations in DIN concentrations after adding the atmospheric nitrogen deposition in the 36°N section (Unit: mmol/m3) |
南黄海中部主要初级生产过程包括春季表层浮游植物水华和夏季次表层叶绿素最大值现象,图 8为大气氮沉降对两个重要初级生产过程的影响。添加大气氮沉降后黄海中部海域春季表层(5月)叶绿素浓度增加的较为明显,增加量最大达到0.20 mg/m3(见图 8(a)),可达水华期间峰值浓度的10%,而近岸区域叶绿素浓度增加并不明显。这是由于沿岸区域,由于受河流输入以及人类活动影响较大,海洋表层DIN较为丰富,大气氮沉降量与本底值相比较小,对浮游植物生长影响也就很小;黄海中部浮游植物水华过程消耗了大量营养盐,此时大气氮沉降是营养盐的有效补充,进而使水华强度增大。夏季(8月),36°N断面上叶绿素浓度的变化量分布可以看出(见图 8(b)),次表层的增幅明显,而表层没有明显的增加。海洋表层经历了春季水华过程之后,各种营养盐消耗殆尽,到了夏季,大气氮沉降有利地缓解了DIN的缺乏,但表层磷酸盐由于没有额外补充而成为限制因子,因此大气氮沉降不会促进浮游植物生长,叶绿素浓度增长并不明显;而在次表层,从表层进入的氮沉降到达次表层,缓解了此处的氮限制情况,促进此处初级生产过程,叶绿素浓度增加显著。

|
图 8 添加大气沉降后春季表层(a)与夏季36°N断面叶绿素浓度变化量(b)的空间分布(单位:mg/m3) Fig. 8 The spatial distributions of the variations in the chlorophyll concentrations in the surface layer during spring (a) and in the 36°N section during summer (b) after adding the atmospheric nitrogen deposition (Unit: mg/m3) |
冬季,由于温度和光照限制了浮游植物对水中营养盐的吸收,此时大气沉降的营养盐就会存留在水中,与春季大气氮沉降一起支持浮游植物的旺发。为了区分冬季和春季的大气沉降对春季水华过程的影响,本研究设计了两个数值实验(实验3和4)。图 9为分别只添加冬季或春季氮沉降下南黄海春季水华期间表层叶绿素浓度增加量的分布。冬季存留下的氮到了春季促进了春季水华强度(见图 9(a)),与不添加大气沉降的结果相比,最大增加量为0.05 mg/m3以上,黄海中部区域平均增加量约为0.03 mg/m3。与冬季相比,春季的大气氮沉降对春季水华的促进作用更加明显,由图 9(b)可以看出,增加量大于0.05 mg/m3的区域范围明显大于冬季添加大气沉降的结果,与不添加大气沉降的结果相比,最大值增加量可以达到0.10 mg/m3以上,黄海中部区域平均增加量约为0.05 mg/m3。结果表明,虽然冬季南黄海氮沉降量并不少,但由于冬季大风混合作用,通过海表进入水体中的氮被带到整个水层,到了春季仅有部分留在真光层中支持了水华过程。然而,春季的大气沉降可以直接被浮游植物生长所利用,直接缓解了水华期间营养盐缺乏的情况,对春季水华的促进作用更加明显。

|
图 9 在不同季节添加大气氮沉降后春季黄海表层的叶绿素浓度变化量的水平分布(单位:mg/m3) Fig. 9 The horizontal distributions of the variations in the surface chlorophyll concentrations during spring after adding the atmospheric nitrogen deposition in different seasons in the Yellow Sea (Unit: mg/m3) |
实验3、4和5分别为只在冬季、春季和夏季添加大气氮沉降的模拟,将所得结果与全年不添加大气氮沉降结果对比(见图 10),研究不同季节的氮沉降对夏季次表层叶绿素最大值现象的影响。冬季大气氮沉降一部分在真光层内支持春季水华期间的浮游植物生长,一部分则沉降到达海洋次表层,到了夏季时被浮游植物生长吸收,促进了此时次表层叶绿素最大值现象,与不添加大气沉降的结果相比,次表层叶绿素浓度的最大增加量约为0.03 mg/m3(见图 10(a))。春季添加的大气氮沉降则大部分被春季海洋真光层内的水华过程所消耗,沉降到次表层的量较少,所以对夏季次表层的影响比冬季沉降要小,最大增加量约为0.02 mg/m3(见图 10(b))。夏季,由于水体层化较强,此时的大气沉降的氮都在上层水体中存留,少部分到达较深的水层,对次表层叶绿素浓度的影响与春季沉降相当,小于冬季沉降(见图 10(c))。

|
图 10 在不同季节添加大气氮沉降后夏季36°N断面叶绿素浓度变化量的垂向分布(单位:mg/m3) Fig. 10 The vertical distributions of the variations in the chlorophyll concentrations during summer after adding the atmospheric nitrogen deposition in different seasons in the 36°N section (Unit: mg/m3) |
大气沉降作为海洋生态系统中氮元素的主要外源,会直接增加海洋氮贮库,影响海洋中营养盐浓度与比例,从而改变海洋氮循环过程及速率[1]。基于加与不加大气氮沉降的模型结果(实验1和实验2),本研究定量计算了模型中所涉氮循环中的三个过程的改变,即浮游植物生长吸收、呼吸释放以及碎屑矿化。图 11为三个过程全年平均水柱积分的变化量的分布图。可以看出,添加大气氮沉降之后,浮游植物生长吸收的无机氮量有明显增加,变化量最大可达2.0 mg·m-2·d-1以上,整个海域平均增大约10%。相应地,浮游植物呼吸释放无机氮量也有相应的增长,最大可达1.5 mg·m-2·d-1以上。浮游植物生长吸收的增加量大于呼吸释放的变化量,说明大气氮沉降对南黄海初级生产过程的促进作用显著。同时,碎屑矿化量也有增加,矿化过程是有机碎屑产生营养盐的过程,而有机碎屑的主要来源是浮游植物死亡,因此大气氮沉降在促进浮游植物生物量的同时,也相应促进了矿化过程,使得浮游植物生物量增长明显的南黄海东部海域矿化量也显著增加,变化量最大可达2.0 mg·m-2·d-1。

|
( (a),(b),(c)分别表示浮游植物生长消耗的氮,浮游植物呼吸释放的氮,矿化过程产生的氮。(a), (b), and (c) show the DIN consumption due to growth of phytoplankton, the DIN release due to breathing of phytoplankton, the DIN release due to mineralization, respectively. ) 图 11 添加大气沉降后年均海洋水柱积分氮通量变化量的水平分布(单位:mg·m-2·d-1) Fig. 11 The horizontal distributions of the variations in the yearly mean vertically integrated nitrogen fluxes after adding the atmospheric deposition (Unit: mg·m-2·d-1) |
春季水华和夏季次表层叶绿素最大值现象是南黄海两个重要的初级生产过程,各营养盐外部来源均会对其产生影响,其中大气沉降的作用不容忽视。本文利用三维物理-生态耦合模型定量估算了大气氮沉降的影响。大气氮沉降最明显的作用是增加了黄海氮储量,近岸区域最为明显,向中部海区逐渐递减,这主要是由于近岸海域无机氮来源众多,本身水体中DIN浓度较高,氮不是限制浮游植物生长的主要因子,因此大气氮沉降不会被浮游植物生长吸收,容易出现氮累积。春季水华期间,由大气氮沉降提供的叶绿素浓度的增加达到了峰值浓度的10%,数值实验显示冬季的氮沉降在水体中的存留可以促进接下来的春季浮游植物旺发,而春季的氮沉降影响更加显著。大气氮沉降对夏季次表层叶绿素最大值的贡献为6%,且冬季沉降的存留影响最大,夏季的沉降在水体强层化的情况下难以到达次表层,只留在表层提高了此处的氮磷比。
本研究仅考虑了大气无机氮沉降对海洋初级生产力的影响,同时有研究表明大气沉降的其他物质也对海洋生态系统产生一定影响,比如大气有机氮沉降可能会影响海洋生态系统的结构[47],大气沉降中的无机磷也会促进特定海区的初级生产力[48],并且大气沉降中的铁和铜对浮游植物生长有一定的抑制作用[48-50]。除此之外,本研究中模型使用的大气沉降数据为稀疏的观测结果,整个南黄海取值相同,事实上大气沉降存在一定的空间差异,以后的研究中将利用空气质量模型的模拟结果,更加准确的估算大气氮沉降对海洋初级生产力的贡献。
| [1] |
高会旺, 姚小红, 郭志刚, 等. 大气沉降对海洋初级生产过程与氮循环的影响研究进展[J]. 地球科学进展, 2014, 29(12): 324-332. Gao Hui-wang, Yao Xiao-hong, Guo Zhi-gang, et al. Atmospheric deposition connected with marine primary production and nitrogen cycle: A review[J]. Advances in Earth Science, 2014, 29(12): 324-332. (  0) 0) |
| [2] |
Duce R A, Liss P S, Merrill J T Atlas, et al. The atmospheric input of trace species to the world ocean[J]. Global Biogeochem Cycles, 1991, 5(3): 193-259. DOI:10.1029/91GB01778
(  0) 0) |
| [3] |
Paerl H W, Dennis R L, Whitall D R. Atmospheric deposition of nitrogen: Implications for nutrient over-enrichment of coastal waters[J]. Estuaries, 2002, 25(4b): 677-693.
(  0) 0) |
| [4] |
Boulart, lament C P F, Gentilhomme V, et al. Atmospherically-promoted photosyntetic activity in a well-mixed ecosystem: Significance of wet deposition events of nitrogen compounds[J]. Estuar Coast Shelf Sci, 2006, 69: 449-458. DOI:10.1016/j.ecss.2006.04.021
(  0) 0) |
| [5] |
Ohara, Akimoto T H, Kurokawa J, et al. An Asian emission inventory of anthropogenic emission sources for the period 1980-2020[J]. Atmos Chem Phys, 2007, 7: 4419-4444. DOI:10.5194/acp-7-4419-2007
(  0) 0) |
| [6] |
Uno I, Uematsu M, Hara Y, et al. Numerical study of the atmospheric input of anthropogenic total nitrate to the marginal seas in the western North Pacific region[J]. Geophysical Research Letters, 2007, 34(17): L17817. DOI:10.1029/2007GL030338
(  0) 0) |
| [7] |
Duce R A, La Roche, Altieri J, et al. F Galloway impacts of atmospheric anthropogenic nitrogen on the open ocean[J]. Sci Rev, 2008, 320: 893-897.
(  0) 0) |
| [8] |
Zhang J, Liu M G. Observations on nutrient elements and sulphate in atmospheric wet deposition over the Northwest Pacific coastal oceans-Yellow Sea[J]. Mar Chem, 1994a, 47: 173-189. DOI:10.1016/0304-4203(94)90107-4
(  0) 0) |
| [9] |
Zhang J. Atmospheric wet deposition of nutrient elements: Correlation with harmful biological blooms in northwest Pacific Coastal Zones[J]. Ambio, 1994b, 23: 464-468. DOI:10.2307/4314261
(  0) 0) |
| [10] |
Zhang G S, Zhang J, Liu S M. Characterization of nutrients in the atmospheric wet and dry deposition observed at the two monitoring sites over Yellow Sea and East China Sea[J]. J Atmos Chem, 2007a, 57: 41-57. DOI:10.1007/s10874-007-9060-3
(  0) 0) |
| [11] |
Qi J H, Shi J H, Gao H W, et al. Atmospheric dry and wet deposition of nitrogen species and its implication for primary productivity in coastal region of the Yellow Sea[J]. China Atmospheric Environment, 2013, 81: 600-608. DOI:10.1016/j.atmosenv.2013.08.022
(  0) 0) |
| [12] |
Chung C S, Hong G H, Kim S H, et al. Shore based observation on wet deposition of inorganic nutrients in the Korean Yellow Sea coast[J]. The Yellow Sea Res, 1998, 4: 30-39.
(  0) 0) |
| [13] |
Tan S C, Shi G Y, Wang H. Long-range transport of spring dust storms in Inner Mongolia and impact on the China seas[J]. Atmospheric Environment, 2012, 46: 299-308. DOI:10.1016/j.atmosenv.2011.09.058
(  0) 0) |
| [14] |
Tan S C, Wang H. The transport and deposition of dust and its impact on phytoplankton growth in the Yellow Sea[J]. Atmospheric Environment, 2014, 99: 491-499. DOI:10.1016/j.atmosenv.2014.10.016
(  0) 0) |
| [15] |
Shi J H, Gao H W, Zhang J, et al. Examination of causative link between a spring bloom and dry/wet deposition of Asian dust in the Yellow Sea, China[J]. J Geophys Res, 2012, 117(D17).
(  0) 0) |
| [16] |
Blumberg A F, Mellor. A Description of a Three Dimensional Coastal Ocean Circulation Model[C].[s.l.]: Coastal and Estuarine Series Geophys Union, 1987.
(  0) 0) |
| [17] |
Mellor G L. Users Guide for a three-Dimensional, Primitive Equation, Numerical Ocean Model[M]. USA: Princeton University: Program in Atmospheric and Oceanic Sciences, 1998.
(  0) 0) |
| [18] |
Guo X Y, Hukuda H. A triply nested ocean model for simulating the Kuroshio-roles of horizontal resolution on JEBAR[J]. J Phys Oceanogr, 2003, 33: 146-169. DOI:10.1175/1520-0485(2003)033<0146:ATNOMF>2.0.CO;2
(  0) 0) |
| [19] |
Aksnes D L, Ulvestad K B. Ecological modelling in coastal waters: Towards predictive physical-chemical-biological simulation models[J]. Ophelia, 1995, 41: 5-36. DOI:10.1080/00785236.1995.10422035
(  0) 0) |
| [20] |
Skogen M D. A user's guide to NORWECOM v2. 0, a coupled 3 dimensional physical chemical biological ocean-model[J]. The NORW Ecological Model System, 1998, 42: 18-98.
(  0) 0) |
| [21] |
Zhao L, Guo X Y. Influence of cross-shelf water transport on nutrient and phytoplankton in the East China Sea: A model study[J]. Ocean Sci, 2011, 7: 27-43. DOI:10.5194/os-7-27-2011
(  0) 0) |
| [22] |
Chen C T A. Chemical and physical fronts in the Bohai, Yellow and East China seas[J]. J Marine Syst, 2009, 78(3): 394-410. DOI:10.1016/j.jmarsys.2008.11.016
(  0) 0) |
| [23] |
Zhang J. Nutrient elements in large Chinese estuaries[J]. Cont Shelf Res, 1996, 16: 1023-1045. DOI:10.1016/0278-4343(95)00055-0
(  0) 0) |
| [24] |
Zhang J, Liu S M, Ren J L, et al. Nutrient gradients from the eutrophic Changjiang (Yangtze River) Estuary to the oligotrophic Kuroshio waters and re-evaluation of budgets for the East China Sea Shelf[J]. Prog Oceanogr, 2007b, 74: 449-478. DOI:10.1016/j.pocean.2007.04.019
(  0) 0) |
| [25] |
Liu S M, Hong G H, Zhang J, et al. Nutrient budgets for large Chinese estuaries[J]. Biogeosciences, 2009, 6: 2245-2263. DOI:10.5194/bg-6-2245-2009
(  0) 0) |
| [26] |
Jia L, Xi G, Liu S, et al. Regional estimation of daily to annual regional evapotranspiration with MODIS data in the Yellow River Delta wetland[J]. Hydrol Earth Syst Sci, 2009, 13: 1775-1787. DOI:10.5194/hess-13-1775-2009
(  0) 0) |
| [27] |
Wang B D, Wang X L, Zhang R. Nutrient conditions in the Yellow Sea and the East China Sea[J]. Estuarine Coast Shelf Sci, 2003, 58: 127-136.
(  0) 0) |
| [28] |
Liu S M, Zhang J, Chen H T, et al. Nutrients in the Changjiang and its tributaries[J]. Biogeochemistry, 2003, 62: 1-18. DOI:10.1023/A:1021162214304
(  0) 0) |
| [29] |
Zhang J, Chen S Z. Factors influencing changes in rain water composition from urban versus remote regions of the Yellow Sea[J]. J Geophys Res, 1999, 104: 1631-1644. DOI:10.1029/1998JD100019
(  0) 0) |
| [30] |
Zhang G S, Zhang J, Liu S M. Chemical composition of atmospheric wet depositions from the Yellow Sea and East China Sea[J]. Atmospheric Research, 2007, 85: 84-97. DOI:10.1016/j.atmosres.2006.11.005
(  0) 0) |
| [31] |
Wan X F, Wu Z F. Reanalysis of atmospheric flux of nutrients to the South Yellow Sea and the East China Sea[J]. Marine Environmental Science, 2002, 21: 14-18.
(  0) 0) |
| [32] |
Zhu J Y, Shi J, Guo X Y, et al. Air-sea heat flux control on the Yellow Sea Cold Water Mass intensity and implications for its prediction[J]. Continental Shelf Research, 2018, 152: 14-26. DOI:10.1016/j.csr.2017.10.006
(  0) 0) |
| [33] |
韦钦胜, 战闰, 臧家业, 等. 南黄海春季海水化学要素的分布特征及其受控因素[J]. 海洋科学, 2010, 34(3): 52-60. Wei Q S, Zhan R, Zang J Y, et al. Distributions and influence factors of the chemical parameters in the Southern Yellow Sea in spring[J]. Marine Science, 2010, 34(3): 52-60. (  0) 0) |
| [34] |
韦钦胜, 刘璐, 战闰, 等. 夏季南黄海海水化学要素的分布特征及影响因素[J]. 中国海洋大学学报(自然科学版), 2010, 40(1): 82-88. Wei Q S, Liu L, Zhan R, et al. Distribution features of the chemical parameters in the Southern Yellow Sea in Summer[J]. Periodical of Ocean University of China, 2010, 40(1): 82-88. (  0) 0) |
| [35] |
韦钦胜, 臧家业, 魏修华, 等. 秋季南黄海西部营养盐的分布及其与环流场的关系[J]. 海洋学报, 2011, 33: 74-82. Wei Q S, Zang J Y, Wei X H, et al. The distribution of nutrients and the relationship of them with the circulation condition in the western southern Huanghai Sea in autumn[J]. Act Oceanologica Sinca, 2011, 33: 74-82. (  0) 0) |
| [36] |
韦钦胜, 周明, 魏修华, 等. 冬季南黄海海水化学要素的分布特征及变化趋势[J]. 海洋科学进展, 2010c, 28: 353-363. Wei Q S, Zhou M, Wei X H, et al. Distribution features and variation tendency of chemical elements in the Southern Yellow Sea in winter[J]. Marine Science Progress, 2010c, 28: 353-363. (  0) 0) |
| [37] |
Moore T S, Campbell J W, Dowell M D. A class-based approach to characterizing and mapping the uncertainty of the MODIS ocean chlorophyll product[J]. Remote Sensing of Environment, 2009, 113(11): 2424-2430. DOI:10.1016/j.rse.2009.07.016
(  0) 0) |
| [38] |
Yamaguchi H, Ishizaka J, Siswanto E, et al. Seasonal and spring interannual variations in satellite-observed Chlorophyll-a in the Yellow and East China Seas: new datasets with reduced interference from high concentration of resuspended sediment[J]. Continental Shelf Research, 2013, 59: 1-9. DOI:10.1016/j.csr.2013.03.009
(  0) 0) |
| [39] |
Zhang H, Qiu Z, Sun D, et al. Seasonal and interannual variability of satellite-derived chlorophyll-a (2000-2012) in the Bohai Sea, China[J]. Remote Sensing, 2017, 9(6): 582. DOI:10.3390/rs9060582
(  0) 0) |
| [40] |
Shi J, Liu Y, Mao X, et al. Interannual variation of spring phytoplankton bloom and response to turbulent energy generated by atmospheric forcing in the central Southern Yellow Sea of China: Satellite observations and numerical model study[J]. Continental Shelf Research, 2017, 143: 257-270. DOI:10.1016/j.csr.2016.06.008
(  0) 0) |
| [41] |
傅明珠, 王宗灵, 孙萍, 等. 2006年夏季南黄海浮游植物叶绿素a分布特征及其环境调控机制[J]. 生态学报, 2009, 29(10): 5366-5375. Fu M Z, Wang Z L, Sun P, et al. Spatial distribution characteristics and the environmental regulation mechanisms of phytoplankton chlorophyll a in southern Yellow Sea during summer 2006[J]. Acta Ecologica Sinica, 2009, 29(10): 5366-5375. DOI:10.3321/j.issn:1000-0933.2009.10.023 (  0) 0) |
| [42] |
刘光兴, 孔维, 杨桂朋. 夏季南黄海浅海潮汐锋对小拟哲水蚤和叶绿素a分布的影响[J]. 海洋与湖沼, 2015, 46(1): 58-64. Liu G X, Kong W, Yang G P. Influence of tidal front on distribution of paracalannus parvus and Chlorophyll A in summer over south Yellow Sea[J]. Oceanologia Et Limnologia Sinica, 2015, 46(1): 58-64. (  0) 0) |
| [43] |
王保栋, 郑昌洙. 南黄海冬季生源要素的分布特征[J]. 黄渤海海洋, 1999, 17(1): 40-45. Wang B D, Zheng C Z. Distribution features of bioactive elements in Seawater in the Southern Yellow Sea in winter[J]. J Oceanogr Huanghai and Bohai Seas, 1999, 17(1): 40-45. (  0) 0) |
| [44] |
郑国侠, 宋金明, 戴纪翠, 等. 南黄海秋季叶绿素a的分布特征与浮游植物的固碳强度[J]. 海洋学报(中文版), 2006, 28(3): 109-118. Guoxia Z, Jinming S, Jicui D, et al. Distributions of Chlorophyll A and carbon fixed strength of phyto-plankton in autumn of the southern Huanghai Sea waters[J]. Acta Oceanologica Sinca, 2006, 28(3): 109-118. DOI:10.3321/j.issn:0253-4193.2006.03.013 (  0) 0) |
| [45] |
张江涛, 殷克东. 黄海春季表层叶绿素和初级生产力及其粒径结构研究[J]. 生态环境学报, 2010, 19(9): 2107-2111. Jiangtao Z, Kedong Y. Distributions of size-fractioned Chlorophyll-a and primary production of phytoplankton in spring of the Yellow Sea[J]. Ecology and Environmental Sciences (in Chinese), 2010, 19(9): 2107-2111. DOI:10.3969/j.issn.1674-5906.2010.09.015 (  0) 0) |
| [46] |
李曌, 张学雷, 王宗灵, 等. 2008年夏季南黄海叶绿素a垂向分布格局初探[J].海洋科学进展, 2011, 29: 81-89. Li Z, Zhang X L, Wang Z L, Sun P, Xu Z J. Preliminary study on vertical distribution pattern of chlorophyll a in South Yellow Sea in Summer 2008[J]. Marine Science Progress, 2011, 29: 81-89. 10.3969/j.issn.1671-6647.2011.01.010 (  0) 0) |
| [47] |
石金辉, 高会旺, 张经. 大气有机氮沉降及其对海洋生态系统的影响[J]. 地球科学进展, 2006, 21(7): 721-729. Shi J, Gao H, Zhang J. Atmospheric organic nitrogen deposition and significance in marine ecosystem[J]. Advances in Earth Science, 2006, 21(7): 721-729. DOI:10.3321/j.issn:1001-8166.2006.07.010 (  0) 0) |
| [48] |
Zhang C, Gao H, Yao X, et al. Phytoplankton growth response to Asian dust addition in the northwest Pacific Ocean versus the Yellow Sea[J]. Biogeosciences, 2018, 15(3): 749-765. DOI:10.5194/bg-15-749-2018
(  0) 0) |
| [49] |
Martin J H, Fitzwater S E. Iron deficiency limits phytoplankton growth in the north-east Pacific subarctic[J]. Nature, 1988, 331(6154): 341-343. DOI:10.1038/331341a0
(  0) 0) |
| [50] |
Paytan A, Mackey K R M, Chen Y, et al. Toxicity of atmospheric aerosols on marine phytoplankton[J]. Proceedings of the National Academy of Sciences, 2009, 106(12): 4601-4605. DOI:10.1073/pnas.0811486106
(  0) 0) |
2. Laboratory for Marine Ecology and Environmental Science, Qingdao National Laboratory for Marine Science and Technology, Qingdao 266071, China;
3. College of Marine and Environmental Sciences, Tianjin University of Science & Technology, Tianjin 300457, China
 2020, Vol. 50


