2. 中国海洋大学化学化工学院,山东 青岛 266100
汞(Hg)具有高毒性和易于生物富集的特点,且能够在大气中长距离传输[1],这些特性使得汞成为全球关注的污染物。汞的毒性和风险与其化学形态有关。在自然水体中,汞通常以元素汞(Hg0)、二价汞(Hg2+)和甲基汞(MeHg)三种形态存在[2]。Hg2+是水环境中汞的主要存在形式,能够通过生物和非生物途径转化为毒性更强的甲基汞[3]。汞容易与颗粒物结合,进而在沉积物中富集[4]。当环境条件发生变化时,沉积物中的汞又会释放到水体造成二次污染[5]。近几十年来,燃料燃烧、矿产开采和废物处理等人类活动排放的汞显著增加[6]。据估计,每年约有1 000 t汞由河流排放至近海[7]。海湾系统是河流汞排放入海主要的汇。由于半封闭性导致的水交换能力较差,其受汞污染影响较大[8]。此外,海湾水产养殖区内大量的鱼类粪便和未食用饲料中的有机物也会显著影响到汞循环[9]。因此,水产养殖活动密集海湾地区的汞污染问题受到广泛关注[10-11]。
莱州湾是渤海三大主要海湾之一,沿海地区工业、农业和城市化等人类活动对莱州湾的生态环境造成了巨大压力[12]。莱州湾周围十多条河流,特别是黄河,向莱州湾排放了大量污染物[13]。同时,莱州湾是许多海洋生物的产卵和孵化地,也是中国最重要的水产养殖和渔业场所之一[14]。目前,对于莱州湾汞循环已有一些相关研究。Cao等[15]在莱州湾的海洋食物网中发现了汞的生物放大作用,空间分布表明莱州湾的汞污染主要由沿岸的河流输入造成。Jiang等[16]对莱州湾小清河河口溶解性有机质和汞的关联性研究结果显示,二者之间没有强相关性,认为汞的浓度变化受到复杂的生物地球化学过程控制。然而,目前对莱州湾总汞(THg)和MeHg分布特征的认识仍不全面,对其控制因素仍缺乏了解。
为探究莱州湾海水和沉积物中不同形态汞的分布特征与影响因素,本文测定了海水中THg、溶解态汞(DTHg)、颗粒态汞(PTHg)、MeHg、溶解态甲基汞(DMeHg)和颗粒态甲基汞(PMeHg)的浓度及沉积物中THg和MeHg的含量,分析了不同形态汞的分布特征与影响因素。
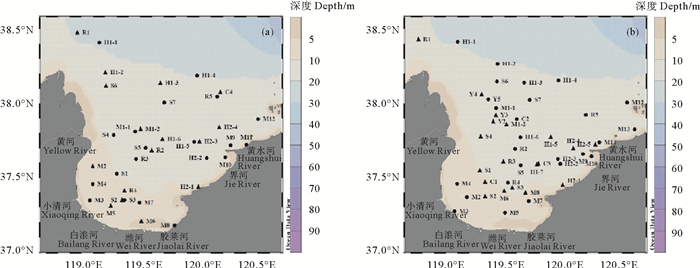
1 材料与方法 1.1 样品采集与保存本研究于2018年10月和2019年5月采集了莱州湾海水和表层沉积物样品(见图 1)。采用Niskin(5 L)采水器采集不同深度(表层和底层)的海水样品转移至硼硅玻璃瓶中,用于测定THg和MeHg。另取一定体积的海水经0.40 μm聚碳酸酯膜过滤后,用于DTHg和DMeHg的测定。水样中分别加入0.5%(v/v)和0.4%(v/v)的盐酸用于分析Hg和MeHg。表层沉积物样品采用箱式采泥器采集,取0~2 cm于封口袋中用于THg和MeHg的测定。水样和沉积物样品测定前均在-20 ℃条件下冷冻保存。

|
( 圆点代表同时采集海水和沉积物样品站位,三角代表仅采集海水样品站位。Round circles represent stations where seawater and sediment samples were collected simultaneously, while triangles represent stations where seawater samples were collected only. ) 图 1 2018年10月(a)和2019年5月(b)莱州湾采样站位图 Fig. 1 Sampling sites in Laizhou Bay in October, 2018 (a) and May, 2019(b) |
海水中THg和DTHg的测定参照EPA 1631方法[17]。向25 mL未过滤/过滤的海水中加入125 μL氯化溴(BrCl)消解12 h,然后加入62.5 μL盐酸羟胺除去过量的BrCl。加入125 μL (20% w/v)氯化亚锡(SnCl2)将Hg2+还原为Hg0,采用汞自动分析仪(Model Ⅲ,美国Brooks Rand公司)测定。PTHg由THg和DTHg的差值求得。
海水中MeHg和DMeHg的测定参照EPA 1630方法[18]。向特氟龙蒸馏管内加入45 mL未过滤/过滤的水样,在(125±3) ℃的条件下通高纯氮气((90±10)mL/min)蒸馏约2.5~4 h。将蒸馏后的样品转移至气泡瓶内,加入65 mL超纯水至100 mL。加入50 μL四乙基硼化钠(NaBEt4)反应15 min后,通高纯氮气(200 mL/min)15 min将乙基化衍生物吹扫捕集至Tenax管上。吸附的乙基化衍生物在经过热解吸、分离、原子化后,采用冷原子荧光光谱仪(Model Ⅲ,美国Brooks Rand公司)测定。PMeHg由MeHg和DMeHg的差值求得。
1.2.2 沉积物中THg和MeHg的测定沉积物中THg的测定参照EPA 7474方法[19]。取0.5 g冷冻干燥过筛后的沉积物于安瓿瓶中,加入2 mL HNO3和1 mL超纯水,用火焰喷枪封口后在105 ℃条件下消解1 h。取0.1 mL上清液用1% HCl稀释至25 mL,加入SnCl2还原后采用汞自动分析仪测定。
沉积物中MeHg的测定参照EPA 1630方法[18]。取0.5 g沉积物样品于50 mL离心管中,加入5 mL 1.5 mol/L KBr/H2SO4溶液和1 mL 1 mol/L CuSO4溶液,置于振荡器中在300 r/min条件下振荡12 h。样品中加入10 mL CH2Cl2后再振荡1 h,在4 000 r/min下离心15 min,取2 mL有机相至35 mL超纯水中,在45 ℃水浴下通高纯氮气(100 mL/min)吹扫约15 min至CH2Cl2完全挥发,取反萃后的样品35 mL于气泡瓶中后采用1.2.1中的方法测定水中的甲基汞。
1.2.3 质量控制为保证数据质量,每批次分析(20个样品)设置2个方法空白,2个沉积物标准物质(ERM-CC580)或2个水样加标回收,并随机选择一个样品平行分析三次进行精密度检验。水样THg和MeHg的方法空白分别为0.4~0.5 ng/L和0.02~0.03 ng/L,满足EPA方法要求(THg < 0.5 ng/L;MeHg < 0.03 ng/L)。水样THg和MeHg的标准添加回收率分别为89%~112%和93%~110%,符合EPA方法要求(THg:75%~125%;MeHg:65%~135%)。沉积物THg和MeHg的方法空白(THg:0.04~0.06 ng/g;MeHg:0.015~0.016 ng/g)与标准物质回收率(THg:90%~101%;MeHg:89%~108%)也满足EPA方法要求(方法空白:THg < 2.0 ng/g;MeHg < 0.12 ng/g;回收率:THg:70%~130%;MeHg:65%~135%)。THg和MeHg平行样的相对标准偏差(RSD)分别为1.3%~13.6%和3.9%~13.3%,也在方法要求的范围内(RSD < 15%)。
1.2.4 相关参数的测定温度(T)、盐度(S)、pH、溶解氧(DO)和叶绿素(Chl a)使用便携式多参仪(AP-700,英国Aquaread公司)现场测定。取500 mL海水样品经0.45 μm玻璃纤维膜过滤后,采用重量法测定悬浮颗粒物含量(SPM)。海水中溶解有机碳(DOC)通过总有机碳分析仪(TOC-VCPH,日本岛津公司)测定,硝酸盐(NO3-)和总氮(TN)使用营养盐自动分析仪(AACSII,德国Bran+Luebbe公司)进行分析。沉积物烧失量(LOI)通过在550 ℃下高温灼烧6 h的质量差得到。使用电感耦合等离子体原子发射光谱仪(iCAP-6300,美国Thermo Fisher公司)测定沉积物中的铁(Fe)和锰(Mn)的浓度。
2 结果与讨论 2.1 莱州湾海水中THg和MeHg的浓度与平面分布2018年10月和2019年5月莱州湾海水中THg浓度分别为(4.5±5.4) ng/L(0.8~39.5 ng/L)和(3.5±4.4) ng/L(0.5~26.0 ng/L),均低于国家海水水质一级标准(50 ng/L)[20]。2018年10月THg浓度显著高于2019年5月(Mann-Whitney U检验,p < 0.05),这可能是由于雨季随河流等排放至莱州湾的Hg增多[21]。与其他海湾相比,莱州湾THg浓度远低于锦州湾[22],而高于Masan Bay[23]和Bay of Biscay[24],总体处于中间水平(见表 1)。DTHg浓度低于胶州湾[8],而高于其他海湾,PTHg浓度相对较低。有(69.4±23.2)%的THg存在于悬浮颗粒物中,表明THg浓度主要由PTHg含量决定[25],DTHg/THg比值与胶州湾相当[8]。
|
|
表 1 莱州湾及其他海湾海水中THg、DTHg、PTHg浓度和DTHg/THg比值 Table 1 THg, DTHg, PTHg concentrations and DTHg/THg ratio in seawater of the Laizhou Bay and other bays |
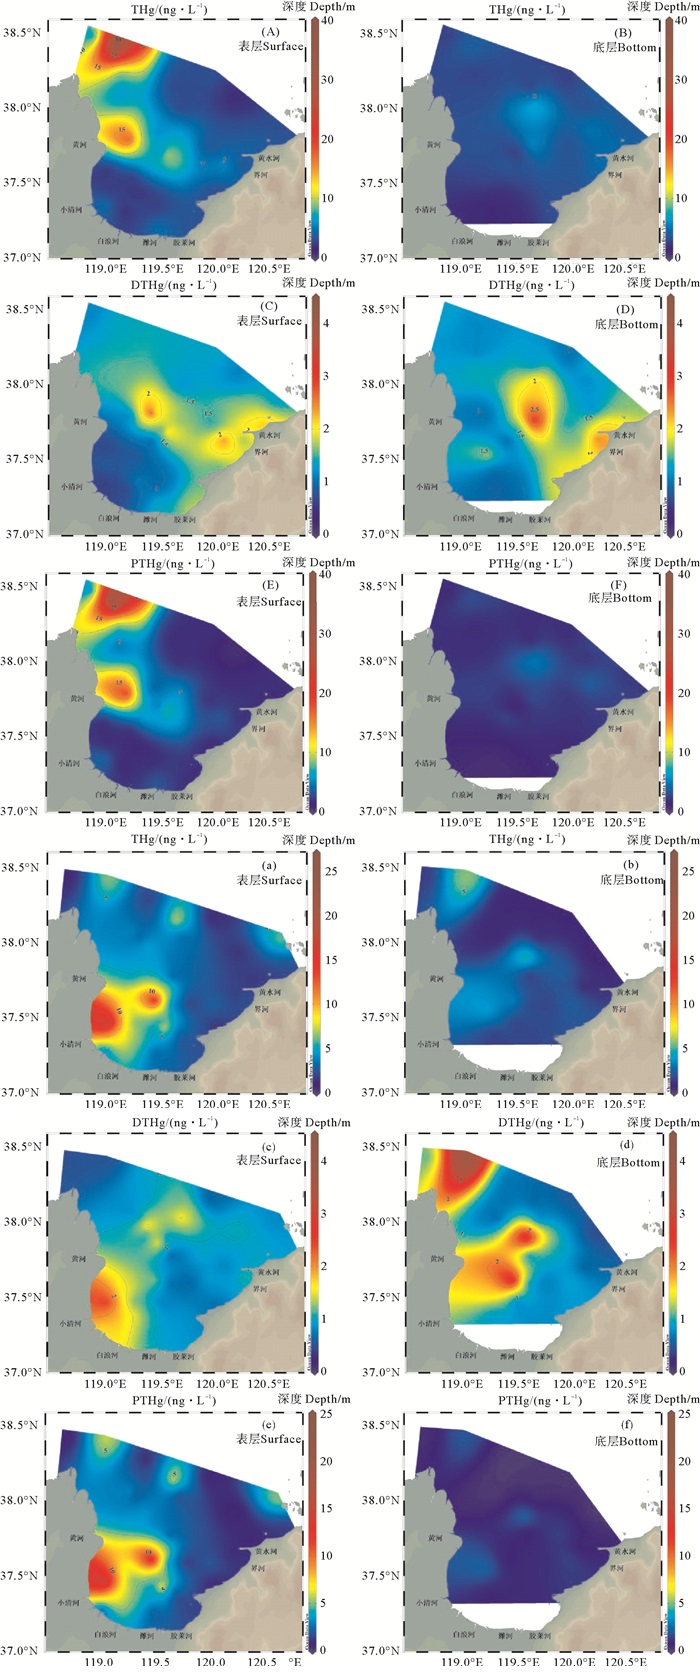
平面分布上,莱州湾秋季表层海水中THg在黄河口附近有两个高值区(见图 2(A)),底层海水中THg在湾口中央观察到一个高值区(见图 2(B))。与秋季不同,春季表层和底层海水中THg的空间分布相似(见图 2(a)和图 2(b)),高值区位于黄河和小清河河口处。总体上,莱州湾西侧表层THg含量高于东侧,可能与黄河输入有关。根据国家海洋局监测数据,2017年黄河排放至莱州湾的重金属多达317 t[31]。秋季PTHg的分布趋势和THg类似(见图 2(E)和图 2(A)),而DTHg在黄水河和界河河口处浓度较高(见图 2(C)和图 2(D)),春季DTHg和PTHg的分布趋势均与THg相似(见图 2(c)—(f))。

|
图 2 2018年10月(A)-(F)和2019年5月(a)-(f)莱州湾海水中THg(A)-(B,(a)-(b)、DTHg(C)-(D),(c)-(d)和PTHg(E)-(F),(e)-(f)的平面分布 Fig. 2 Spatial distribution of THg (A)-(B), (a)-(b), DTHg (C)-(D), (c)-(d) and PTHg (E)-(F), (e)-(f) in Laizhou Bay seawater in October, 2018 (A)-(F) and May, 2019 (a)-(f) |
2018年10月和2019年5月莱州湾海水中MeHg的浓度分别为(0.15±0.12) ng/L(0.03~0.51 ng/L)和(0.13±0.08) ng/L(ND~0.42 ng/L),两个季节的MeHg浓度没有显著性差异(Mann-Whitney U检验,p>0.05)。相较于其他海湾,莱州湾MeHg浓度明显高于Chesapeake Bay[26]和Masan Bay[23],而低于Guanabara Bay[28]和胶州湾[8]。DMeHg浓度处于中等水平,PMeHg浓度高于Bay of Biscay[24],与其他海湾相当(见表 2)。有(49.8±23.7)%的MeHg以颗粒态形式存在,DMeHg/MeHg比值处于中等水平。莱州湾海水中MeHg/THg比值远高于New York/New Jersey Harbor Estuary[25],与Bay of Biscay[24]和Masan Bay[23]的MeHg/THg比值接近。
|
|
表 2 莱州湾及其他海湾海水中MeHg、DMeHg、PMeHg浓度和DMeHg/MeHg、MeHg/THg比值 Table 2 MeHg, DMeHg, PMeHg concentrations and DMeHg/MeHg, MeHg/THg ratio in seawater of the Laizhou Bay and other bays |
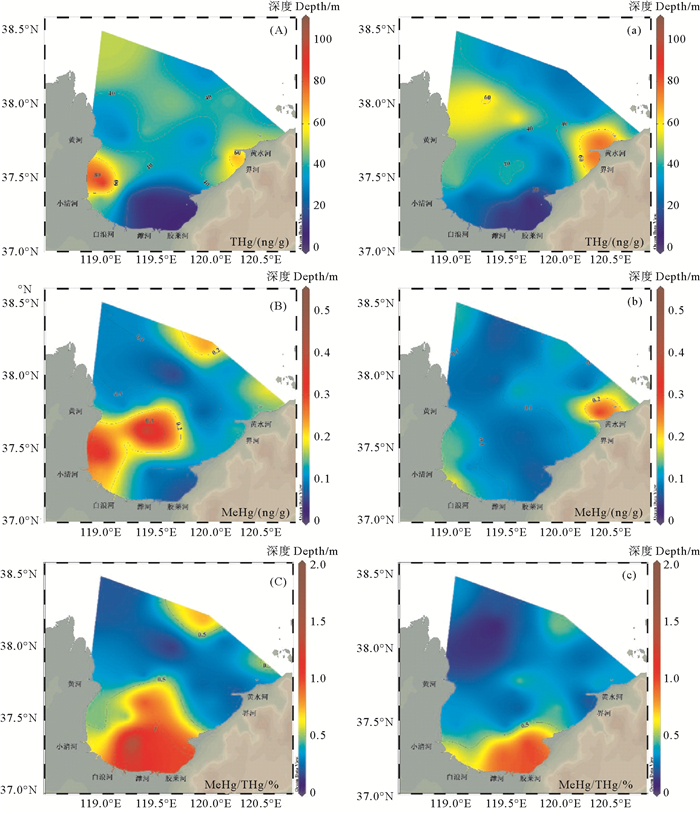
与THg相比,莱州湾海水中MeHg的分布更为复杂(见图 3),这可能主要是由于MeHg既受输入影响也受原位生成控制[32]。两个季节均在黄河和小清河河口处存在高值区,有研究显示小清河中THg和MeHg浓度高于河口[16],表明河流的陆源污染物输入对莱州湾海水MeHg分布有显著影响。此外,春季表层海水中MeHg在潍河河口附近浓度也较高(见图 3(a))。DMeHg和PMeHg的分布趋势与MeHg近似,在黄河和小清河河口处浓度较高。海水中MeHg/THg比值的空间分布与MeHg相似,高值区主要位于河口处。MeHg/THg比值可以用来代表甲基化潜力[33],说明原位甲基汞生成可能对莱州湾甲基汞分布起着重要的控制作用。

|
图 3 2018年10月((A)-(H))和2019年5月((a)-(h))莱州湾海水中MeHg((A)-(B),(a)-(b),ng/L)、DMeHg((C)-(D),(c)-(d),ng/L)、PMeHg((E)-(F),(e)-(f),ng/L)和MeHg/THg((G)-(H),(g)-(h),%)的平面分布 Fig. 3 The spatial distribution of MeHg (A)-(B), (a)-(b), ng/L), DMeHg ((C)-(D), (c)-(d), ng/L), PMeHg ((E)-(F), (e)-(f), ng/L) and MeHg/THg ((G)-(H), (g)-(h), %) in Laizhou Bay seawater in October, 2018 ((A)-(H)) and May, 2019 ((a)-(h)) |
2018年10月和2019年5月莱州湾沉积物中THg的浓度分别为(40.5±25.4) ng/g(5.8~109.2 ng/g)和(39.4±23.2) ng/g(5.3~97.4 ng/g),均低于国家海洋沉积物质量一级标准(200 ng/g)[34]。沉积物可以揭示长期环境影响下THg的分布特征[35],受季节影响较小,这可能是两个季节沉积物中THg浓度没有显著性差异的原因(Mann-Whitney U检验,p>0.05)。相较于其他海湾,莱州湾沉积物中THg浓度处于较低水平(见表 3)。
|
|
表 3 莱州湾及其他海湾沉积物中THg、MeHg浓度和MeHg/THg比值 Table 3 THg, MeHg concentrations and MeHg/THg ratio in sediments of the Laizhou Bay and other bays |
平面分布上,莱州湾秋季沉积物中THg在东西两侧各有一个高值区,分别位于黄河口和界河河口附近(见图 4(A))。界河流域内的招远市有着悠久的黄金开采和冶炼历史,有研究表明,金矿开采和冶炼会导致环境中汞等重金属浓度的增加[42]。沉积物中THg在春季同样呈现湾中央低于两侧的分布趋势(见图 4(a)),这与胶州湾沉积物中THg的空间分布相似[8],有研究比较了莱州湾西南沿岸河流和海洋沉积物中THg浓度,发现海洋沉积物中THg含量远低于河流沉积物[14],说明陆源输入显著影响了沉积物中THg的含量。

|
图 4 2018年10月((A)-(C))和2019年5月((a)-(c))莱州湾沉积物中THg((A),(a),ng/g)、MeHg((B),(b),ng/g)和MeHg/THg比值((C),(c),%)的平面分布 Fig. 4 Spatial distribution of THg ((A), (a), ng/g), MeHg ((B), (b), ng/g) and MeHg/THg ratio ((C), (c), %) in Laizhou Bay sediments in October, 2018 (A)-(C) and May, 2019 (a)-(c) |
2018年10月和2019年5月莱州湾沉积物中MeHg的浓度分别为(0.16±0.13) ng/g(0.04~0.51 ng/g)和(0.11±0.08) ng/g(0.05~0.43 ng/g)。两个季节沉积物中MeHg浓度没有显著性差异(Mann-Whitney U检验,p>0.05)。与其他海湾相比(见表 3),莱州湾沉积物中MeHg浓度与大亚湾[30]和Masan Bay[23]相当,而远低于锦州湾[22]和Minamata Bay[38]。莱州湾沉积物中MeHg/THg比值相较于其他海湾属于较高水平,表明莱州湾沉积物汞的甲基化潜力较高。
莱州湾沉积物中MeHg的高值区在秋季位于黄河口和小清河河口附近(见图 4(B)),在春季位于黄水河河口附近(见图 4(b))。作为沉积物中MeHg的重要来源,海水中PMeHg在河口处也存在高值区(见图 3),表明陆源输入对莱州湾沉积物中MeHg分布具有显著影响。河流携带的细颗粒物质很容易吸附环境中的有机质,这可能是莱州湾MeHg的重要来源[35]。沉积物中MeHg/THg比值的空间分布与THg分布趋势并不完全相同,在白浪河、潍河与胶莱河河口处存在高值区,表明除THg含量外陆源输入也在汞甲基化分布中起着重要作用。
2.3 影响莱州湾不同形态Hg分布的环境因素为了识别影响莱州湾海水中THg、DTHg、PTHg、MeHg、DMeHg、PMeHg和MeHg/THg比值的关键因素,将不同形态汞的浓度、比例与相关环境参数进行了Spearman相关性分析和多元回归分析(见表 4)。Spearman相关性分析结果显示,THg与DO和Chl a呈显著负相关,与DOC、NO3-和SPM呈显著正相关。有研究表明,浮游植物能有效吸收水中的汞[43],这可能是导致THg与Chl a呈显著负相关的原因。THg与DOC呈显著正相关,可能是因为生成的Hg2+-DOM络合物比较稳定,使得可供还原的Hg减少[44]。进一步通过多元回归分析得到,THg和MeHg受SPM影响最大。THg与SPM的正相关关系表明汞对颗粒物有较高的亲和性,这与之前的研究结果一致[45]。此外,有研究在颗粒态中发现了较高的MeHg浓度,说明颗粒物对甲基汞也存在吸附作用[46]。在DTHg与PTHg、DMeHg与PMeHg之间均观察到较好的正相关关系,说明海水中溶解态和颗粒态汞可以互相转化[8]。相关性分析表明,THg与MeHg没有显著相关性,说明海水原位甲基化不是莱州湾海水中MeHg的主要来源。
|
|
表 4 莱州湾海水中不同形态Hg与环境参数的相关性分析和多元回归分析 Table 4 Correlation analyses and multiple regression analyses of Hg species against environmental parameters in Laizhou Bay seawater |
通过Spearman相关性分析和多元回归分析识别了影响莱州湾沉积物中THg、MeHg和MeHg/THg比值的关键因素(见表 5)。Spearman相关性分析结果显示,THg与Fe呈显著正相关,可能是与Fe的氧化物发生了吸附或共沉淀[47]。THg与LOI也呈显著正相关,说明有机质对沉积物中THg的富集有重要作用[48]。沉积物中THg与MeHg存在正相关关系,然而在THg含量相对较低的沉积物中也观察到了较高浓度的MeHg(见图 4),这表明除THg含量外,莱州湾沉积物中汞的甲基化还受到其他因素的影响,如有机碳和细菌活性[49-50]。此外,MeHg/THg比值与Fe、Mn和LOI呈负相关,反映了地球化学因素和沉积物理化性质对汞甲基化潜力的共同影响。进一步通过多元回归分析得到,沉积物中THg主要受有机碳含量影响,汞甲基化潜力受总汞含量影响最大。
|
|
表 5 莱州湾沉积物中THg、MeHg和MeHg/THg比值与环境参数的相关性分析和多元回归分析 Table 5 Correlation analyses and multiple regression analyses of THg, MeHg and MeHg/THg ratio against environmental parameters in Laizhou Bay sediments |
莱州湾海水和沉积物中THg含量分别为3.97和39.9 ng/g,均符合国家一级标准。海水和沉积物中MeHg的浓度分别为0.14和0.13 ng/g,污染水平与其他海湾相当。海水中约69.4%的THg以颗粒态形式存在,约49.8%的MeHg以颗粒态形式存在。莱州湾海水中THg和MeHg的浓度在西侧高于东侧,高值区位于黄河和小清河河口处。沉积物中THg和MeHg的浓度在湾中部低于两侧近岸区域。这些结果表明陆源输入对莱州湾THg和MeHg的含量存在显著影响。相关性分析表明,SPM是影响莱州湾海水中THg和MeHg分布的主要环境因素,沉积物中THg主要受有机碳含量影响,总汞含量是影响沉积物中汞甲基化的最重要因素。
| [1] |
Gworek B, Dmuchowski W, Baczewska-Dąbrowska A H. Mercury in the terrestrial environment: A review[J]. Environmental Sciences Europe, 2020, 32(1): 1-19. DOI:10.1186/s12302-019-0282-1 (  0) 0) |
| [2] |
Ma M, Du H X, Wang D Y, et al. Biotically mediated mercury methylation in the soils and sediments of Nam Co Lake, Tibetan Plateau[J]. Environmental Pollution, 2017, 227: 243-251. DOI:10.1016/j.envpol.2017.04.037 (  0) 0) |
| [3] |
Driscoll C T, Mason R P, Chan H M, et al. Mercury as a global pollutant: Sources, pathways, and effects[J]. Environmental Science & Technology, 2013, 47(10): 4967-4983. (  0) 0) |
| [4] |
Amos H M, Jacob D J, Kocman D, et al. Global biogeochemical implications of mercury discharges from rivers and sediment burial[J]. Environmental Science & Technology, 2014, 48(16): 9514-9522. (  0) 0) |
| [5] |
Vieira H C, Bordalo M D, Figueroa A G, et al. Mercury distribution and enrichment in coastal sediments from different geographical areas in the North Atlantic Ocean[J]. Marine Pollution Bulletin, 2021, 165: 112153. DOI:10.1016/j.marpolbul.2021.112153 (  0) 0) |
| [6] |
Kim K H, Kabir E, Jahan S A. A review on the distribution of Hg in the environment and its human health impacts[J]. Journal of Hazardous Materials, 2016, 306: 376-385. DOI:10.1016/j.jhazmat.2015.11.031 (  0) 0) |
| [7] |
Liu M D, Zhang Q R, Maavara T, et al. Rivers as the largest source of mercury to coastal oceans worldwide[J]. Nature Geoscience, 2021, 14: 672-677. DOI:10.1038/s41561-021-00793-2 (  0) 0) |
| [8] |
Mao L L, Liu X T, Wang B D, et al. Occurrence and risk assessment of total mercury and methylmercury in surface seawater and sediments from the Jiaozhou Bay, Yellow Sea[J]. Science of The Total Environment, 2020, 714: 136539. DOI:10.1016/j.scitotenv.2020.136539 (  0) 0) |
| [9] |
Xu Z T, Wu S C, Christie P, et al. Impacts of estuarine dissolved organic matter and suspended particles from fish farming on the biogeochemical cycling of mercury in Zhoushan island, eastern China Sea[J]. Science of the Total Environment, 2020, 705: 135921. DOI:10.1016/j.scitotenv.2019.135921 (  0) 0) |
| [10] |
Du Y X, Meng F P, Fu W C, et al. Distribution, speciation and bioaccumulation of Hg and As in mariculture sediments from Dongshan Bay, China[J]. Soil and Sediment Contamination, 2016, 25(5): 489-504. DOI:10.1080/15320383.2016.1166175 (  0) 0) |
| [11] |
Liang P, Shao D D, Wu S C, et al. The influence of mariculture on mercury distribution in sediments and fish around Hong Kong and adjacent mainland China waters[J]. Chemosphere, 2011, 82(7): 1038-1043. DOI:10.1016/j.chemosphere.2010.10.061 (  0) 0) |
| [12] |
Liu J H, Cao L, Dou S Z. Trophic transfer, biomagnification and risk assessments of four common heavy metals in the food web of Laizhou Bay, the Bohai Sea[J]. Science of The Total Environment, 2019, 670: 508-522. DOI:10.1016/j.scitotenv.2019.03.140 (  0) 0) |
| [13] |
Gu X, Xin M, Wang J, et al. Quantitative source identification and environmental assessment of trace elements in the water and sediment of rivers flowing into Laizhou Bay, Bohai Sea[J]. Marine Pollution Bulletin, 2022, 174: 113313. DOI:10.1016/j.marpolbul.2021.113313 (  0) 0) |
| [14] |
Zhuang W, Gao X L. Distributions, sources and ecological risk assessment of arsenic and mercury in the surface sediments of the southwestern coastal Laizhou Bay, Bohai Sea[J]. Marine Pollution Bulletin, 2015, 99(1-2): 320-327. DOI:10.1016/j.marpolbul.2015.07.037 (  0) 0) |
| [15] |
Cao L, Liu J H, Dou S Z, et al. Biomagnification of methylmercury in a marine food web in Laizhou Bay (North China) and associated potential risks to public health[J]. Marine Pollution Bulletin, 2020, 150: 110762. DOI:10.1016/j.marpolbul.2019.110762 (  0) 0) |
| [16] |
Jiang T, Skyllberg U, Green N W, et al. Characteristics of dissolved organic matter (DOM) and its relationship with dissolved mercury in Xiaoqing River-Laizhou Bay estuary, Bohai Sea, China[J]. Environmental Pollution, 2017, 223: 19-30. DOI:10.1016/j.envpol.2016.12.006 (  0) 0) |
| [17] |
United States Environmental Protection Agency. Method 1631: Mercury in Water by Oxidation, Purge and Trap, and Cold Vapor Atomic Fluorescence Spectrometry[S]. Washington: United States Environmental Protection Agency, 2002.
(  0) 0) |
| [18] |
United States Environmental Protection Agency. Method 1630: Methyl Mercury in Water by Distillation, Aqueous Ethylation, Purge and Trap, and CVAFS[S]. Washington: United States Environmental Protection Agency, 2001.
(  0) 0) |
| [19] |
United States Environmental Protection Agency. Method 7474: Mercury in Sediment and Tissue Samples by Atomic Fluorescence Spectrometry[S]. Washington: United States Environmental Protection Agency, 2007.
(  0) 0) |
| [20] |
国家环境保护部. GB 3097-1997海水水质标准[S]. 北京: 中国标准出版社, 1997. National Ministry of Environmental Protection. GB 3097-1997 Seawater Quality Standard[S]. Beijing: Standards Press of China, 1997. (  0) 0) |
| [21] |
Li M K, Zhu S Y, Ouyang T P, et al. Magnetic properties of the surface sediments in the Yellow River Estuary and Laizhou Bay, Bohai Sea, China: Implications for monitoring heavy metals[J]. Journal of Hazardous Materials, 2020, 410: 124579. (  0) 0) |
| [22] |
Wang S F, Jia Y F, Wang S Y, et al. Total mercury and monomethylmercury in water, sediments, and hydrophytes from the rivers, estuary, and bay along the Bohai Sea coast, northeastern China[J]. Applied Geochemistry, 2009, 24(9): 1702-1711. DOI:10.1016/j.apgeochem.2009.04.037 (  0) 0) |
| [23] |
Kim E, Kim H, Shin K H, et al. Biomagnification of mercury through the benthic food webs of a temperate estuary: Masan Bay, Korea[J]. Environmental Toxicology and Chemistry, 2012, 31(6): 1254-1263. DOI:10.1002/etc.1809 (  0) 0) |
| [24] |
Sharif A, Monperrus M, Tessier E, et al. Fate of mercury species in the coastal plume of the Adour River estuary (Bay of Biscay, SW France)[J]. Science of the Total Environment, 2014, 496: 701-713. DOI:10.1016/j.scitotenv.2014.06.116 (  0) 0) |
| [25] |
Balcom P H, Hammerschmidt C R, Fitzgerald W F, et al. Seasonal distributions and cycling of mercury and methylmercury in the waters of New York/New Jersey Harbor Estuary[J]. Marine Chemistry, 2007, 109(1-2): 1-17. (  0) 0) |
| [26] |
Lawson N M, Mason R P, Laporte J M. The fate and transport of mercury, methylmercury, and other trace metals in chesapeake bay tributaries[J]. Water Research, 2001, 35(2): 501-515. DOI:10.1016/S0043-1354(00)00267-0 (  0) 0) |
| [27] |
Conaway C H, Squire S, Mason R P, et al. Mercury speciation in the San Francisco Bay estuary[J]. Marine Chemistry, 2003, 80(2): 199-225. (  0) 0) |
| [28] |
Kehrig H A, Seixas T G, Baêta A P, et al. Inorganic and methylmercury: Do they transfer along a tropical coastal food web?[J]. Marine Pollution Bulletin, 2010, 60(12): 2350-2356. DOI:10.1016/j.marpolbul.2010.08.010 (  0) 0) |
| [29] |
Matsuyama A, Eguchi T, Sonoda I, et al. Mercury speciation in the water of Minamata Bay, Japan[J]. Water, Air, & Soil Pollution, 2011, 218(1-4): 399-412. (  0) 0) |
| [30] |
Tao H C, Zhao K Y, Ding W Y, et al. The level of mercury contamination in mariculture sites at the estuary of Pearl River and the potential health risk[J]. Environmental Pollution, 2016, 219: 829-836. DOI:10.1016/j.envpol.2016.07.067 (  0) 0) |
| [31] |
国家海洋局. 2017年中国海洋生态环境状况公报[R]. 北京: 中国海洋出版社, 2018. State Oceanic Administration of China. Bulletin of China marine ecological environment status 2017[R]. Beijing: China Ocean Press, 2018. (  0) 0) |
| [32] |
Batrakova N, Travnikov O, Rozovskaya O. Chemical and physical transformations of mercury in the ocean: A review[J]. Ocean Science, 2014, 10(6): 1047-1063. DOI:10.5194/os-10-1047-2014 (  0) 0) |
| [33] |
Yu C H, Xiao W J, Xu Y P, et al. Spatial-temporal characteristics of mercury and methylmercury in marine sediment under the combined influences of river input and coastal currents[J]. Chemosphere, 2021, 274: 129728. DOI:10.1016/j.chemosphere.2021.129728 (  0) 0) |
| [34] |
国家质量监督检验检疫总局. GB 18668-2002海洋沉积物质量[S]. 北京: 中国标准出版社, 2002. Quality Supervision and Quarantine Bureau of China. GB 18668-2002 Marine Sediment Quality[S]. Beijing: Standards Press of China, 2002. (  0) 0) |
| [35] |
Dang P, Gu X, Lin C Y, et al. Distribution, sources, and ecological risks of potentially toxic elements in the Laizhou Bay, Bohai Sea: Under the long-term impact of the Yellow River input[J]. Journal of Hazardous Materials, 2021, 413: 125429. DOI:10.1016/j.jhazmat.2021.125429 (  0) 0) |
| [36] |
Ouddane B, Mikac N, Cundy A B, et al. A comparative study of mercury distribution and methylation in mudflats from two macrotidal estuaries: The Seine (France) and the Medway (United Kingdom)[J]. Applied Geochemistry, 2008, 23(4): 618-631. DOI:10.1016/j.apgeochem.2007.11.001 (  0) 0) |
| [37] |
Bouchet S, Bridou R, Tessier E, et al. An experimental approach to investigate mercury species transformations under redox oscillations in coastal sediments[J]. Marine Environmental Research, 2010, 71(1): 1-9. (  0) 0) |
| [38] |
Matsuyama A, Yano S, Hisano A, et al. Distribution and characteristics of methylmercury in surface sediment in Minamata Bay[J]. Marine Pollution Bulletin, 2016, 109(1): 378-385. (  0) 0) |
| [39] |
Akito M, Shinichiro Y, Akihiro H, et al. Reevaluation of Minamata Bay, 25 years after the dredging of mercury-polluted sediments[J]. Marine Pollution Bulletin, 2014, 89(1-2): 112-120. (  0) 0) |
| [40] |
Taylor V F, Buckman K L, Seelen E A, et al. Organic carbon content drives methylmercury levels in the water column and in estuarine food webs across latitudes in the Northeast United States[J]. Environmental Pollution, 2019, 246: 639-649. (  0) 0) |
| [41] |
Zhao L, Wang R, Zhang C, et al. Geochemical controls on the distribution of mercury and methylmercury in sediments of the coastal East China Sea[J]. Science of The Total Environment, 2019, 667: 133-141. (  0) 0) |
| [42] |
Edinger E N, Azmy K, Diegor W, et al. Heavy metal contamination from gold mining recorded in Porites lobata skeletons, Buyat-Ratototok district, North Sulawesi, Indonesia[J]. Marine Pollution Bulletin, 2008, 56(9): 1553-1569. (  0) 0) |
| [43] |
Canário J, Santos-Echeandia J, Padeiro A, et al. Mercury and methylmercury in the Atlantic sector of the Southern Ocean[J]. Deep-Sea Research Part Ⅱ, 2016, 138: 52-62. (  0) 0) |
| [44] |
Soerensen A L, Mason R P, Balcom P H, et al. Drivers of surface ocean mercury concentrations and air-sea exchange in the West Atlantic Ocean[J]. Environmental Science & Technology, 2013, 47(14): 7757-7765. (  0) 0) |
| [45] |
Chakraborty P, Jayachandran S, Lekshmy J, et al. Seawater intrusion and resuspension of surface sediment control mercury (Hg) distribution and its bioavailability in water column of a monsoonal estuarine system[J]. Science of The Total Environment, 2019, 660: 1441-1448. (  0) 0) |
| [46] |
Cesário R, Mota A M, Caetano M, et al. Mercury and methylmercury transport and fate in the water column of Tagus estuary (Portugal)[J]. Marine Pollution Bulletin, 2018, 127: 235-250. (  0) 0) |
| [47] |
Cesário R, Hintelmann H, O'Driscoll N J, et al. Biogeochemical cycle of mercury and methylmercury in two highly contaminated areas of Tagus Estuary (Portugal)[J]. Water, Air, & Soil Pollution, 2017, 228: 1-19. (  0) 0) |
| [48] |
Ge M, Liu G J, Liu Y, et al. An 87-year sedimentary record of mercury contamination in the Old Yellow River Estuary of China[J]. Marine Pollution Bulletin, 2018, 135: 47-54. (  0) 0) |
| [49] |
Duan D D, Lei P, Lan W L, et al. Litterfall-derived organic matter enhances mercury methylation in mangrove sediments of South China[J]. Science of The Total Environment, 2021, 765: 142763. (  0) 0) |
| [50] |
Lei P, Zhong H, Duan D D, et al. A review on mercury biogeochemistry in mangrove sediments: Hotspots of methylmercury production?[J]. Science of The Total Environment, 2019, 680: 140-150. (  0) 0) |
2. College of Chemistry and Chemical Engineering, Ocean University of China, Qingdao 266100, China
 2022, Vol. 52

