在风洞试验中, 试验模型的绕流密度场信息是模型优化设计及选型的重要参数. 为了获得直观、准确的密度场分布信息, 国内外许多研究者一直致力于探索研究各种技术手段来实现模型绕流密度场的可视化观测. 目前, 用于流场密度场显示的技术主要包括经典纹影技术、干涉技术、背景纹影技术等. 其中, 背景纹影技术是将用于流场测量的PIV技术和纹影技术结合起来创造的一种流场测量新技术, 结合了PIV的粒子示踪、粒子图像处理技术和传统纹影技术的基本原理[1-2]. 它可以像PIV技术一样进行较大视场的流场测量, 但又不需要使用经典纹影技术中的大量精密光学仪器, 并且也不需要大口径的均匀平行光源, 能更好地满足风洞现场需要[3-6].
得益于背景纹影技术(background orieted schli-eren, BOS)的优点, 国内外广泛地采用该技术进行各种流场的密度场定性显示和定量测量[7-23]. Sourgen等基于BOS和干涉测量技术开展了锥头柱体、半球体、尖钉凸体等模型的密度场定量测量研究[24], 在下吹式超声速风洞中获得了来流Mach 2和3条件下的密度场测量结果, 并与CFD进行了相互验证, 在激波区域最大差异约10%. Reinholtz等基于BOS技术在美国16T风洞中开展了人员舱模型的定性流场显示试验[25], 获得了多个Mach数下、不同压力、不同模型姿态条件下的流场显示结果. Suriyanarayanan等针对微爆炸波流场应用BOS技术进行了密度场测量, 采用对称性重构方法获得了定量的三维流场密度分布[26], 结果表明, BOS技术对于密度场数据获取和CFD数据验证都具有极大的应用潜力. Clem等在小型热喷射声学台(small hot jet acoustic rig,SHJAR)设备上基于BOS技术观察了圆形喷射气流流场, 研究了尖叫噪声、激波数量、间距与频率的关系, 并以此作为飞行器降噪设计的参考数据, 试验Ma=1.0~1.7[27]. 赵玉新等提出了基于背景纹影矢量场的高分辨率全场气动光学畸变与抖动测量方法[28], 之后丁浩林等采用脉冲激光作为照明光源, 搭建基于BOS的波前测试系统, 并获得了6 ns时间分辨的波前测试结果[29]. 可见, 背景纹影技术作为新兴的流场密度场测量技术, 在风洞及其他流场中有着巨大的应用潜力, 但在高超声速瞬态流场的应用研究报道还较少.
随着针对超声速和高超声速复杂流场研究的进一步深入, 毫秒量级积分的密度场信息已不能满足研究需要, 而瞬态(纳秒量级)的流场细节更有利于揭示其复杂流动机理, 为飞行器外形优化设计和选型提供流场数据支撑. 为了探索高超声速瞬态流场显示方法, 实现超声速流场瞬态“冻结”能力, 获得模型瞬态绕流密度场分布的可视化信息, 基于背景纹影技术和纳秒脉冲激光器搭建了双方向密度场可视化系统, 针对非对称尖锥模型开展了瞬态密度场可视化试验, 得到了Ma=6来流条件下瞬态的模型绕流流场细节, 并与毫秒量级曝光时间的密度场信息进行了对比分析.
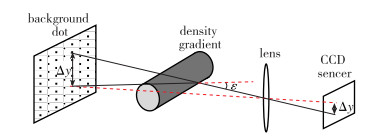
1 测量原理 1.1 背景纹影原理背景纹影技术的本质是基于气体折射率与密度之间的近似线性关系, 利用光线折射现象间接解算流场密度分布信息. 当一束光线入射进入一种存在折射率梯度的介质中时, 光线会向折射率增大的方向偏折, 如图 1所示. 由Glaston-Dale定律可知, 气体折射率与密度的关系为[30]
| $ n - 1 = \rho {K_{{\rm{G - D}}}} $ |
|
| 图 1 背景纹影测量原理图 Fig.1 Principle of BOS method |
式中, n为气体折射率, ρ为气体密度, KG-D为Glaston-Dale常数. KG-D取决于气体的特性, 仅与光波长有关, 但光波长对其影响较小, 二者之间存在如下关系
| $ {K_{{\rm{G - D}}}}\left( \lambda \right) = 2.224{\rm{ }}4 \times {10^{ - 4}}\cdot\left( {1 + {{\left( {\frac{{6.7 \times {{10}^{ - 8}}}}{\lambda }} \right)}^2}} \right) $ |
式中, λ为光波长. 穿过的光线轨迹的曲率半径可表示为折射率梯度
| $\frac{1}{R} = \nabla n $ |
式中, R为光线轨迹的曲率半径, n为折射率. 那么, 光线的偏折角为
| $ \varepsilon = \frac{L}{R} = L{K_\text{G - D}}\nabla \rho $ |
式中, L为光线穿过的路径长度, ▽ρ为密度梯度. 上式表明, 光线的偏折角正比于气体介质的密度梯度. 经过进一步的推导[30], 可得到Poisson方程为
| $ {\nabla ^2}n = \frac{{{\partial ^2}n}}{{\partial {x^2}}} + \frac{{{\partial ^2}n}}{{\partial {y^2}}} = C\cdot\left[ {\frac{\partial }{{\partial x}}\Delta x + \frac{\partial }{{\partial y}}\Delta y} \right] $ |
式中, C为常数, 与实验配置相关; Δx,Δy为测量获得的不同方向的斑点位移量. 如此, 通过斑点位移量即可表征流场密度场信息.
为了获得流场密度场显示结果, 试验中须拍摄两幅背景点图案的图像. 一幅为停风状态的图像, 即不存在密度梯度(图像无畸变); 另一幅为吹风状态时的图像, 存在密度梯度, 相应的背景图案存在变形. 采用互相关算法可解算出两幅图像的互相关情况, 并计算得出两幅图像中背景斑点的位移矢量. 当光线穿过测量体积内的有密度梯度的区域时, 位移矢量就表征了光线在该处的偏折情况, 正比于该处的密度梯度. 因此, 位移矢量场可定性地等同于经典纹影图像, 从而表征密度场分布.
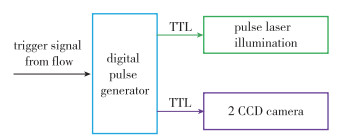
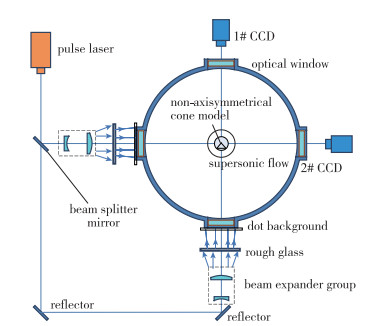
1.2 瞬态密度场可视化系统搭建搭建的双光路瞬态密度场可视化系统包括2路瞬态激光照明光源、CCD相机、背景板、图像采集及处理计算机、脉冲时序信号控制器等部件. 其中, 脉冲时序信号控制器用于控制系统时序, 确保瞬态激光脉冲光源、CCD相机曝光、流场触发信号的同步配准, 以便精准采集有效流场图像, 如图 2所示. 试验光路布局如图 3所示. 脉冲激光出口光斑直径Ф≈9 mm, 激光出射后首先通过50∶50分光镜将激光分为强度相等的两束激光. 而后利用反射镜使两束光分别沿着相互垂直的方向投射到待测流场. 其中, 每束光都采用扩束镜组将光束扩大至直径Ф=60 mm, 然后照射在漫射匀光屏上. 匀光屏可将原来的同心环状光斑均匀化, 变为亮度均匀的光斑, 并同时具有发散作用, 将光斑放大到所需大小, 使背景屏获得均匀照明, 满足图像采集要求. 照明光强可通过激光器放电电压进行调节.
|
| 图 2 时序控制示意图 Fig.2 Schematic diagram of timing control |
|
| 图 3 测量系统光路图 Fig.3 Schematic diagram of arrangement of optical path in wind tunnel test |
CCD相机最短曝光时间500 ns, 分辨率2 048 pixel×2 048 pixel, 对背景板成像放大率166.7 μ/pixel; 采用的Nd∶YAG脉冲激光光源单脉冲宽度10 ns. 瞬态密度场可视化系统采用YAG脉冲激光器作为光源, 结合CCD相机图像采集, 确保了系统图像采集的有效曝光时间为10 ns, 从而能够达到冻结超声速流场的目的, 实现瞬态流场图像采集. 再通过进一步的斑点图像互相关计算, 即可获得超声速流场瞬态密度场分布的可视化结果.
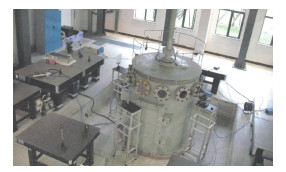
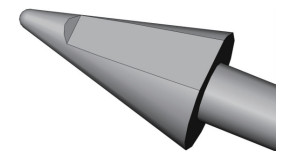
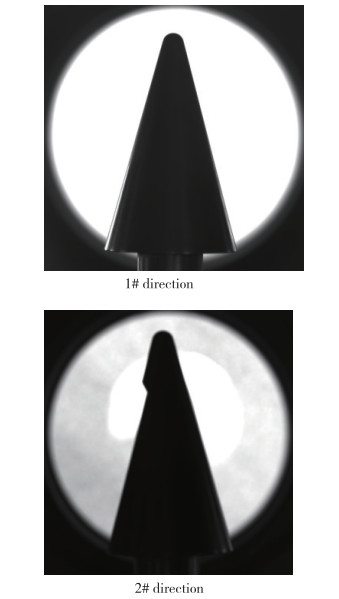
2 试验装置及试验件超声速流场瞬态密度场的可视化试验在Ф=120 mm激波风洞中开展, 试验布局如图 3所示, 现场实物如图 4所示. 试验配置如下: 试验段观察窗直径Ф=200 mm, 试验段真空箱直径Ф=1 800 mm, 喷管型面Ma=6, 试验流场静压4.5 kPa, 稳定有效流场持续时间6 ms, 试验模型采用典型的非对称尖锥模型(如图 5所示). 搭建的密度场可视化系统包括相互垂直的1#方向和2#方向. 1#相机正对模型缺口背面, 2#相机正对模型侧面(如图 6所示), 流场方向自上而下. 试验时, 首先通过背投式瞬态激光光源照明斑点背景板, 而后通过CCD相机拍摄获取停风时与吹风时的背景斑点图案照片. 之后, 通过粒子图像互相关算法, 求取背景斑点由于发出光线受流场偏折影响发生的偏移量, 从而获得流场的密度分布.
|
| 图 4 激波风洞双光路BOS测量实物图 Fig.4 Scene of wind tunnel test on site |
|
| 图 5 非对称尖锥模型 Fig.5 Non-axisymmetrical cone model |
|
| 图 6 模型测量方向 Fig.6 Placement of test model in bi-direction |
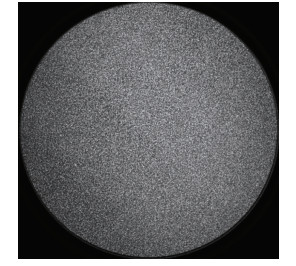
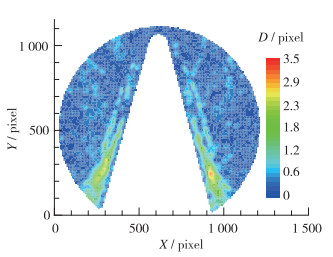
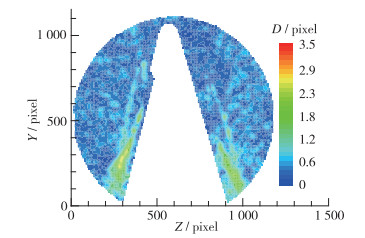
1#方向和2#方向均采用脉冲激光光源照明, 图像采集有效曝光时间为10 ns, 获得了高Mach数激波流场的瞬态密度场分布细节. 试验中, 由于激光照明能量较强、且相机曝光时间短, 斑点图像存在一定噪声, 获得斑点背景如图 7所示. 图 8, 9分别表征了1#方向和2#方向的瞬态密度场分布, 图中D表示背景斑点的位移量,可以观测到高速流场中附着于模型表面的激波线, 远离模型区域也存在许多的密度不连续分布. 通过对空流场时采集的斑点图像对进行互相关处理, 得知噪声影响带来的斑点偏移量最大约为0.2 pixel, 相较于密度梯度带来的斑点位移, 影响很小.
|
| 图 7 激光脉冲瞬态照明斑点背景 Fig.7 Dot background image captured under instantaneous laser illumination |
|
| 图 8 1#方向斑点位移量瞬态分布云图(10 ns) Fig.8 Instantaneous displacement distribution in 1# direction(10 ns) |
|
| 图 9 2#方向位移量瞬态分布云图(10 ns) Fig.9 Instantaneous displacement distribution in 2# direction(10 ns) |
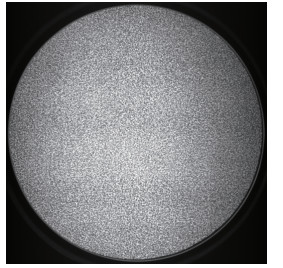
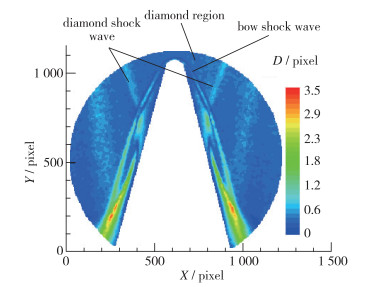
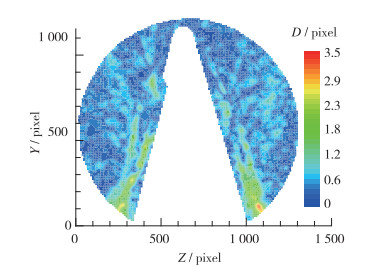
为了比较基于脉冲激光照明的瞬态密度场可视化结果与长曝光积分密度场的区别, 并验证瞬态密度场可视化的重复性, 开展了同样流场来流条件下的第2次密度场可视化试验. 其中, 1#方向采用常亮发光二极管(light-emitting diode, LED)连续照明, 功率600 W, CCD相机曝光时间设置为1 ms. 获得的斑点背景图如图 10所示, 相对于激光瞬态照明的斑点背景图, 由于其曝光时间长, 照明亮度均匀, 粒子图像清晰可见, 相机噪声带来的斑点位移约为0.09 pixel. 图 11表征了1#方向1 ms长曝光的时均密度场分布, 清晰地捕捉到激波风洞流场的菱形激波, 该激波与模型头部弓形激波相互作用, 导致弓形激波形状、波后流场、附面层等发生不同程度改变. 图 12表征了2#方向的瞬态密度场分布. 可见, 1 ms曝光的纹影图清楚地反映了稳定激波流场的各种细节, 包括模型近壁面激波、二道激波、反射激波等细节; 而10 ns曝光的瞬态纹影图与之相比, 流场较为紊乱, 流场密度突起较多, 模型激波线不明显, 反映了瞬态流场的不均匀性.
|
| 图 10 LED常亮照明斑点背景 Fig.10 Dot background image captured under LED illumination |
|
| 图 11 1#方向斑点位移量时均分布云图(1 ms) Fig.11 Long exposure displacement distribution in 1# direction(1 ms) |
|
| 图 12 2#方向斑点位移量瞬态云图(10 ns) Fig.12 Instantaneous displacement distribution in 2# direction(10 ns) |
将10 ns曝光的瞬态纹影图与3.1节测量结果相比(2#方向), 其密度场分布轮廓具有一定的重复性, 但流场细节差异较大, 流场密度突起较多, 突起位置存在较大变化, 表明即使在激波流场相对稳定的时间内, 其瞬态流场也存在演变特性, 具备非定常特征. 可见, 超短时间曝光的瞬态纹影测量能够真实反映瞬态流场细节, 实现更小时间尺度的密度场可视化.
4 结论设计了基于激光脉冲照明的瞬态密度场可视化系统, 并针对非对称尖锥模型在Ф=120 mm激波风洞开展了双方向密度场可视化应用研究, 获得了Ma=6条件下瞬态和长曝光激波流场纹影图像, 得到了超声速流场模型绕流密度场分布的可视化结果. 结果表明, 瞬态背景纹影图像曝光时间为10 ns, 能够有效“冻结”超声速流场; 与长曝光纹影图进行对比, 瞬态图像清晰地显示了更小时间尺度的流场密度场, 且突起较多, 分布不均匀, 也存在时间演变特性. 可见, 基于脉冲激光照明的密度场可视化系统能够获得瞬态激波流场的密度场细节, 为超声速和高超声速流场复杂流动机理的深入理解和研究提供了一种有效方法.
如果条件允许, 采用高频脉冲激光器, 再结合高速相机, 则可搭建能实现时间序列演化的超短曝光瞬态密度场可视化系统, 开展了高超声速流场的瞬态时间演化特征研究, 有助于加深对高超声速流场复杂机理的理解和研究. 可见, 具有系统结构简洁的瞬态密度场可视化系统, 在研究超声速和高超声速流场复杂机理方面有着较大的应用潜力.
| [1] |
Meier G E. Computerized background-oriented schlieren[J]. Experiments in Fluids, 2002, 33(1): 181-187. DOI:10.1007/s00348-002-0450-7 |
| [2] |
Richard H, Raffel M, Rein M, et al. Demonstration of the applicability of a background oriented schlieren (BOS) method[C]. Proceedings of the 9th International Symposium on Applications of Laser Techniques to Fluid Mechanics, 1998, Berlin, Springer-Verlag, 2000: 145-156.
|
| [3] |
Erik G, Jorg S. Background oriented schlieren technique-sensitivity, accuracy, resolution and application to a three-dimensional density field[C]. 13th Int Symp on Applications of Laser Techniques to Fluid Mechanics. Lisbon, Portugal, 2006.
|
| [4] |
Hargather M J, Settles G S. Natural-background-oriented schlieren imaging[J]. Experiments in Fluids, 2010, 48(1): 59-68. DOI:10.1007/s00348-009-0709-3 |
| [5] |
Clem M, Brown C, Fagan A. Background oriented schlieren implementation in a jet-surface interaction test[R]. AIAA 2013-0038, 2013.
|
| [6] |
Raghunath S, Mee D J, Roesgen T, et al. Visualization of supersonic flows in shock tunnels, using the backg-round oriented schlieren technique[C]. AIAA Australian Aerospace Student Conference, Sydney, 2004.
|
| [7] |
Richard H, Raffel M. Principle and applications of the background oriented schlieren (BOS) method[J]. Measurement Science and Technology, 2001, 12(9): 1576-1585. DOI:10.1088/0957-0233/12/9/325 |
| [8] |
Venkatakrishnan L, Meier G E. Density measurements using the background oriented schlieren technique[J]. Experiments in Fluids, 2004, 37(2): 237-247. DOI:10.1007/s00348-004-0807-1 |
| [9] |
Mier F A, Hargather M J. Color gradient background-oriented schlieren imaging[J]. Experiments in Fluids, 2016, 57(6): 95. DOI:10.1007/s00348-016-2183-z |
| [10] |
Venkatakrishnan L. Density measurements in an axisymmetric underexpanded jet by background-oriented schlie-ren technique[J]. AIAA Journal, 2005, 43(7): 1574-1579. DOI:10.2514/1.12647 |
| [11] |
Leopold F. The application of the colored background oriented schlieren technique (CBOS) to free-flight and in-flight measurements[C]. 200722nd International Cong-ress on Instrumentation in Aerospace Simulation Facili-ties. Pacific Grove: IEEE, 2007.
|
| [12] |
Sourgen F, Leopold F, Klatt D. Reconstruction of the density field using the colored background oriented schlieren technique (CBOS)[J]. Optics and Lasers in Engineering, 2012, 50(1): 29-38. DOI:10.1016/j.optlaseng.2011.07.012 |
| [13] |
Bichal A, Thurow B S. On the application of background oriented schlieren for wavefront sensing[J]. Measurement Science and Technology, 2014, 25(1): 5001. |
| [14] |
Ota M, Hamada K, Kato H, et al. Computed-tomogra-phic density measurement of supersonic flow field by coloured grid background oriented schlieren (CGBOS) technique[J]. Measurement Science and Technology, 2011, 22(10): 104011. DOI:10.1088/0957-0233/22/10/104011 |
| [15] |
Van Hinsberg N P, Rösgen T. Density measurements using near-field background-oriented schlieren[J]. Experiments in Fluids, 2014, 55(4): 1720. DOI:10.1007/s00348-014-1720-x |
| [16] |
Kirmse T, Agocs J, Schröder A, et al. Application of particle image velocimetry and the background-oriented schlieren technique in the high-enthalpy shock tunnel göttingen[J]. Shock Waves, 2011, 21(3): 233-241. DOI:10.1007/s00193-011-0314-2 |
| [17] |
Kindler K, Goldhahn E, Leopold F, et al. Recent developments in background oriented schlieren methods for rotor blade tip vortex measurements[J]. Experiments in Fluids, 2007, 43(2): 233-240. DOI:10.1007/s00348-007-0328-9 |
| [18] |
Raffel M. Background-oriented schlieren(BOS) techni-ques[J]. Experiments in Fluids, 2015, 56(3): 60. DOI:10.1007/s00348-015-1927-5 |
| [19] |
Sommersel O K, Bjerketvedt D, Christensen S O, et al. Application of background oriented schlieren for quantitative measurements of shock waves from explosions[J]. Shock Waves, 2008, 18(4): 291-297. DOI:10.1007/s00193-008-0142-1 |
| [20] |
Gojani A B, Kamishi B, Obayashi S. Measurement sensitivity and resolution for background oriented schlieren during image recording[J]. Journal of Visualization, 2013, 16(3): 201-207. DOI:10.1007/s12650-013-0170-5 |
| [21] |
Hartmann U, Adamczuk R, Seume J. Tomographic background oriented schlieren applications for turbomachinery (Invited)[R]. AIAA 2015-1690, 2015.
|
| [22] |
Meier A H, Roesgen T. Improved background oriented schlieren imaging using laser speckle illumination[J]. Experiments in Fluids, 2013, 54(6): 1549. DOI:10.1007/s00348-013-1549-8 |
| [23] |
Mizukaki T, Tsukada H, Wakabayashi K, et al. Quantitative visualization of open-air explosions by using background-oriented schlieren with natural background[C]. 28th International Symposium on Shock Waves. Berlin: Springer, 2011.
|
| [24] |
Sourgen F, Haertig J, George A, et al. Validation of CFD density field validation in supersonic axisymmetric flows using BOS and differential interferometry[R]. AIAA 2005-6036, 2005.
|
| [25] |
Reinholtz C, Heltsley F, Scott K, et al. Visualization of jettison motor plumes from an orion launch abort vehicle wind tunnel model using background-oriented schlieren[R]. AIAA 2010-1736, 2012.
|
| [26] |
Suriyanarayanan P, Karthikeyan N, Venkatakrishnan L, et al. Density field measurements of a micro-explosion using BOS[C]. 28th International Symposium on Shock Wave. Berlin: Springer, 2011: 705-710.
|
| [27] |
Clem M, Zaman K, Fagan A. Background oriented schlieren applied to study shock spacing in a screeching circular jet[R]. AIAA 2012-0403, 2012.
|
| [28] |
赵玉新, 易仕和, 田立丰, 等. 超声速混合层气动光学畸变与抖动——BOS测量技术及其应用[J]. 中国科学: G辑, 2010, 40(1): 33-46. Zhao Y X, Yi S H, Tian L F, et al. Aero-optics distortion and jitter in supersonic mixing layer-BOS measurement and its application[J]. Science China: Physics, Mechanics & Astronomy, 2010, 40(1): 33-46. (in Chinese) |
| [29] |
丁浩林, 易仕和, 吴宇阳, 等. 超声速气膜气动光学效应与Reynolds数相互关系实验研究[J]. 气体物理, 2017, 2(3): 54-63. Ding H L, Yi S H, Wu Y Y, et al. Experimental investigation on relationship between Reynolds number and aero-optics produced by supersonic films[J]. Physics of Gases, 2017, 2(3): 54-63. (in Chinese) |
| [30] |
张俊, 胥頔, 张龙. 基于BOS技术的密度场测量研究[J]. 实验流体力学, 2015, 29(1): 77-82. Zhang J, Xu D, Zhang L. Research on density measurement based on background oriented schlieren method[J]. Journal of Experiments in Fluid Mechanics, 2015, 29(1): 77-82. (in Chinese) |


